Version v2.7.0 of the documentation is no longer actively maintained. The site that you are currently viewing is an archived snapshot.
For up-to-date documentation, see the latest version.
Including 30000 meteorology station, daily, sub-hourly observation records, from 1900-2023. https://github.com/Vonng/isd
It is recommended to use with Pigsty, the battery-included PostgreSQL distribution with Grafana & echarts for visualization. It will setup everything for your with make all;
Otherwise, you’ll have to provide your own PostgreSQL instance, and setup grafana dashboards manually.
Export PGURL in your environment to specify the target postgres database:
# the default PGURL for pigsty's meta database, change that accordinglyexportPGURL=postgres://dbuser_dba:[email protected]:5432/meta?sslmode=disable
psql "${PGURL}" -c 'SELECT 1'# check if connection is ok
make sql # setup postgres schema on target database
Get isd station metadata
The basic station metadata can be downloaded and loaded with:
make reload-station # equivalent to get-station + load-station
Fetch and load isd.daily
To load isd.daily dataset, which is organized by yearly tarball files.
You can download the raw data from noaa and parse with isd parser
make get-parser # download parser binary from github, you can just build with: make buildmake reload-daily # download and reload latest daily data and re-calculates monthly/yearly data
Load Parsed Stable CSV Data
Or just load the pre-parsed stable part from GitHub.
Which is well-formatted CSV that does not require an isd parser.
make get-stable # download stable isd.daily dataset from Githubmake load-stable # load downloaded stable isd.daily dataset into database
More Data
There are two parts of isd datasets needs to be regularly updated: station metadata & isd.daily of the latest year, you can reload them with:
make reload # reload-station + reload-daily
You can download and load isd.daily in a specific year with:
bin/get-daily 2022# get daily observation summary of a specific year (1900-2023)bin/load-daily "${PGURL}"2022# load daily data of a specific year
You can also download and load isd.hourly in a specific year with:
bin/get-hourly 2022# get hourly observation record of a specific year (1900-2023)bin/load-hourly "${PGURL}"2022# load hourly data of a specific year
CREATETABLEIFNOTEXISTSisd.daily(stationVARCHAR(12)NOTNULL,-- station number 6USAF+5WBAN
tsDATENOTNULL,-- observation date
-- temperature & dew point
temp_meanNUMERIC(3,1),-- mean temperature ℃
temp_minNUMERIC(3,1),-- min temperature ℃
temp_maxNUMERIC(3,1),-- max temperature ℃
dewp_meanNUMERIC(3,1),-- mean dew point ℃
-- pressure
slp_meanNUMERIC(5,1),-- sea level pressure (hPa)
stp_meanNUMERIC(5,1),-- station pressure (hPa)
-- visible distance
vis_meanNUMERIC(6),-- visible distance (m)
-- wind speed
wdsp_meanNUMERIC(4,1),-- average wind speed (m/s)
wdsp_maxNUMERIC(4,1),-- max wind speed (m/s)
gustNUMERIC(4,1),-- max wind gust (m/s)
-- precipitation / snow depth
prcp_meanNUMERIC(5,1),-- precipitation (mm)
prcpNUMERIC(5,1),-- rectified precipitation (mm)
sndpNuMERIC(5,1),-- snow depth (mm)
-- FRSHTT (Fog/Rain/Snow/Hail/Thunder/Tornado)
is_foggyBOOLEAN,-- (F)og
is_rainyBOOLEAN,-- (R)ain or Drizzle
is_snowyBOOLEAN,-- (S)now or pellets
is_hailBOOLEAN,-- (H)ail
is_thunderBOOLEAN,-- (T)hunder
is_tornadoBOOLEAN,-- (T)ornado or Funnel Cloud
-- record count
temp_countSMALLINT,-- record count for temp
dewp_countSMALLINT,-- record count for dew point
slp_countSMALLINT,-- record count for sea level pressure
stp_countSMALLINT,-- record count for station pressure
wdsp_countSMALLINT,-- record count for wind speed
visib_countSMALLINT,-- record count for visible distance
-- temp marks
temp_min_fBOOLEAN,-- aggregate min temperature
temp_max_fBOOLEAN,-- aggregate max temperature
prcp_flagCHAR,-- precipitation flag: ABCDEFGHI
PRIMARYKEY(station,ts));-- PARTITION BY RANGE (ts);
ISD Hourly
CREATETABLEIFNOTEXISTSisd.hourly(stationVARCHAR(12)NOTNULL,-- station id
tsTIMESTAMPNOTNULL,-- timestamp
-- air
tempNUMERIC(3,1),-- [-93.2,+61.8]
dewpNUMERIC(3,1),-- [-98.2,+36.8]
slpNUMERIC(5,1),-- [8600,10900]
stpNUMERIC(5,1),-- [4500,10900]
visNUMERIC(6),-- [0,160000]
-- wind
wd_angleNUMERIC(3),-- [1,360]
wd_speedNUMERIC(4,1),-- [0,90]
wd_gustNUMERIC(4,1),-- [0,110]
wd_codeVARCHAR(1),-- code that denotes the character of the WIND-OBSERVATION.
-- cloud
cld_heightNUMERIC(5),-- [0,22000]
cld_codeVARCHAR(2),-- cloud code
-- water
sndpNUMERIC(5,1),-- mm snow
prcpNUMERIC(5,1),-- mm precipitation
prcp_hourNUMERIC(2),-- precipitation duration in hour
prcp_codeVARCHAR(1),-- precipitation type code
-- sky
mw_codeVARCHAR(2),-- manual weather observation code
aw_codeVARCHAR(2),-- auto weather observation code
pw_codeVARCHAR(1),-- weather code of past period of time
pw_hourNUMERIC(2),-- duration of pw_code period
-- misc
-- remark TEXT,
-- eqd TEXT,
dataJSONB-- extra data
)PARTITIONBYRANGE(ts);
Parser
There are two parsers: isdd and isdh, which takes noaa original yearly tarball as input, generate CSV as output (which could be directly consumed by PostgreSQL COPY command).
NAME
isd -- Intergrated Surface Dataset Parser
SYNOPSIS
isd daily [-i <input|stdin>][-o <output|stout>][-v] isd hourly [-i <input|stdin>][-o <output|stout>][-v][-d raw|ts-first|hour-first]DESCRIPTION
The isd program takes noaa isd daily/hourly raw tarball data as input.
and generate parsed data in csv format as output. Works in pipe mode
cat data/daily/2023.tar.gz | bin/isd daily -v | psql ${PGURL} -AXtwqc "COPY isd.daily FROM STDIN CSV;" isd daily -v -i data/daily/2023.tar.gz | psql ${PGURL} -AXtwqc "COPY isd.daily FROM STDIN CSV;" isd hourly -v -i data/hourly/2023.tar.gz | psql ${PGURL} -AXtwqc "COPY isd.hourly FROM STDIN CSV;"OPTIONS
-i <input> input file, stdin by default
-o <output> output file, stdout by default
-p <profpath> pprof file path, enableif specified
-d de-duplicate rows for hourly dataset (raw, ts-first, hour-first) -v verbose mode
-h print help
UI
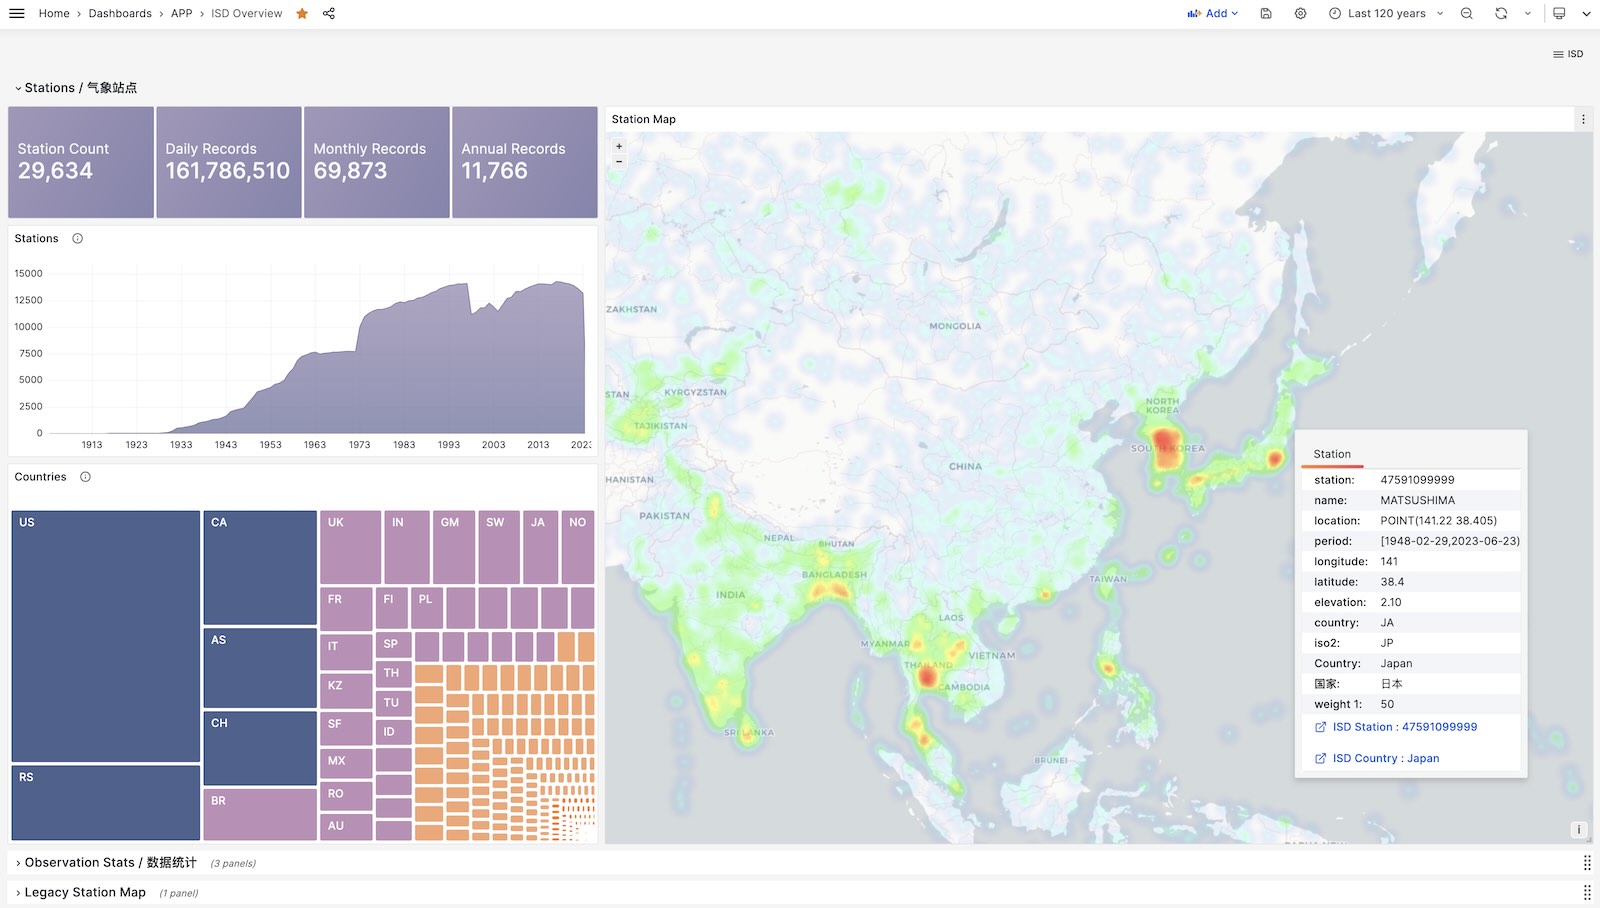
ISD Overview
Show all stations on a world map.
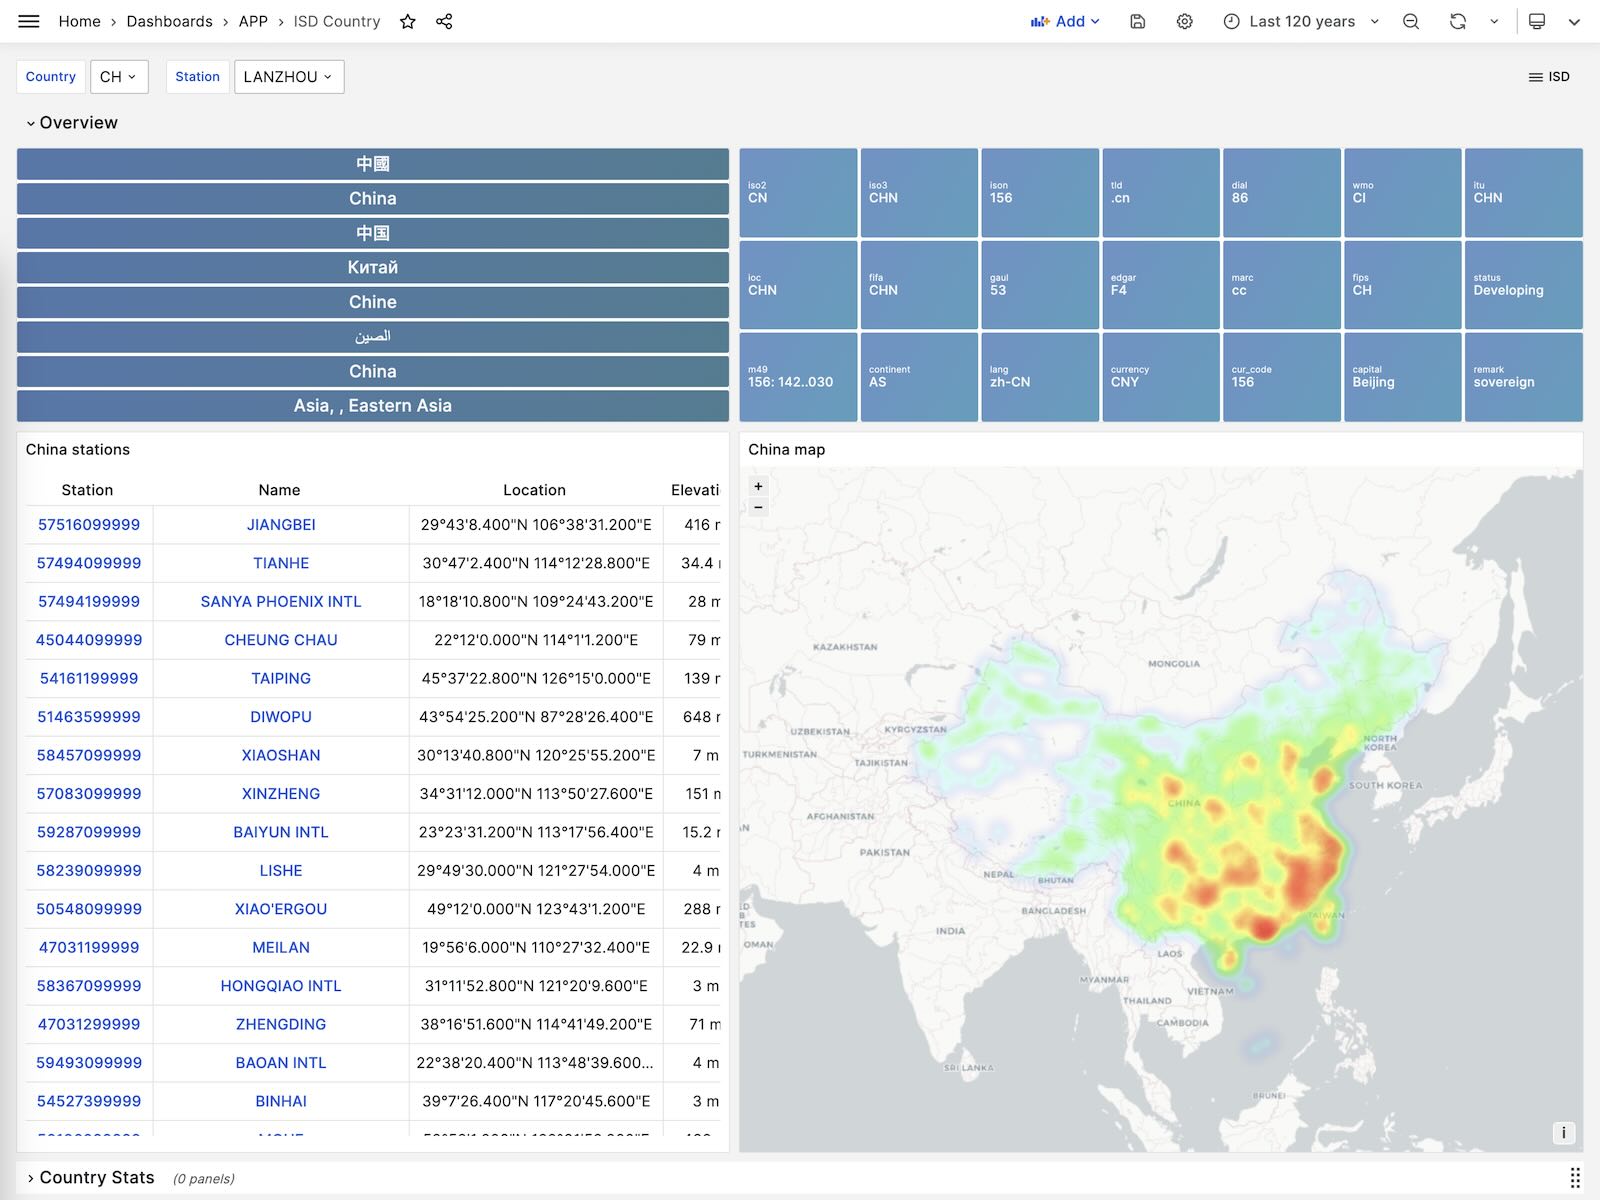
ISD Country
Show all stations among a country.
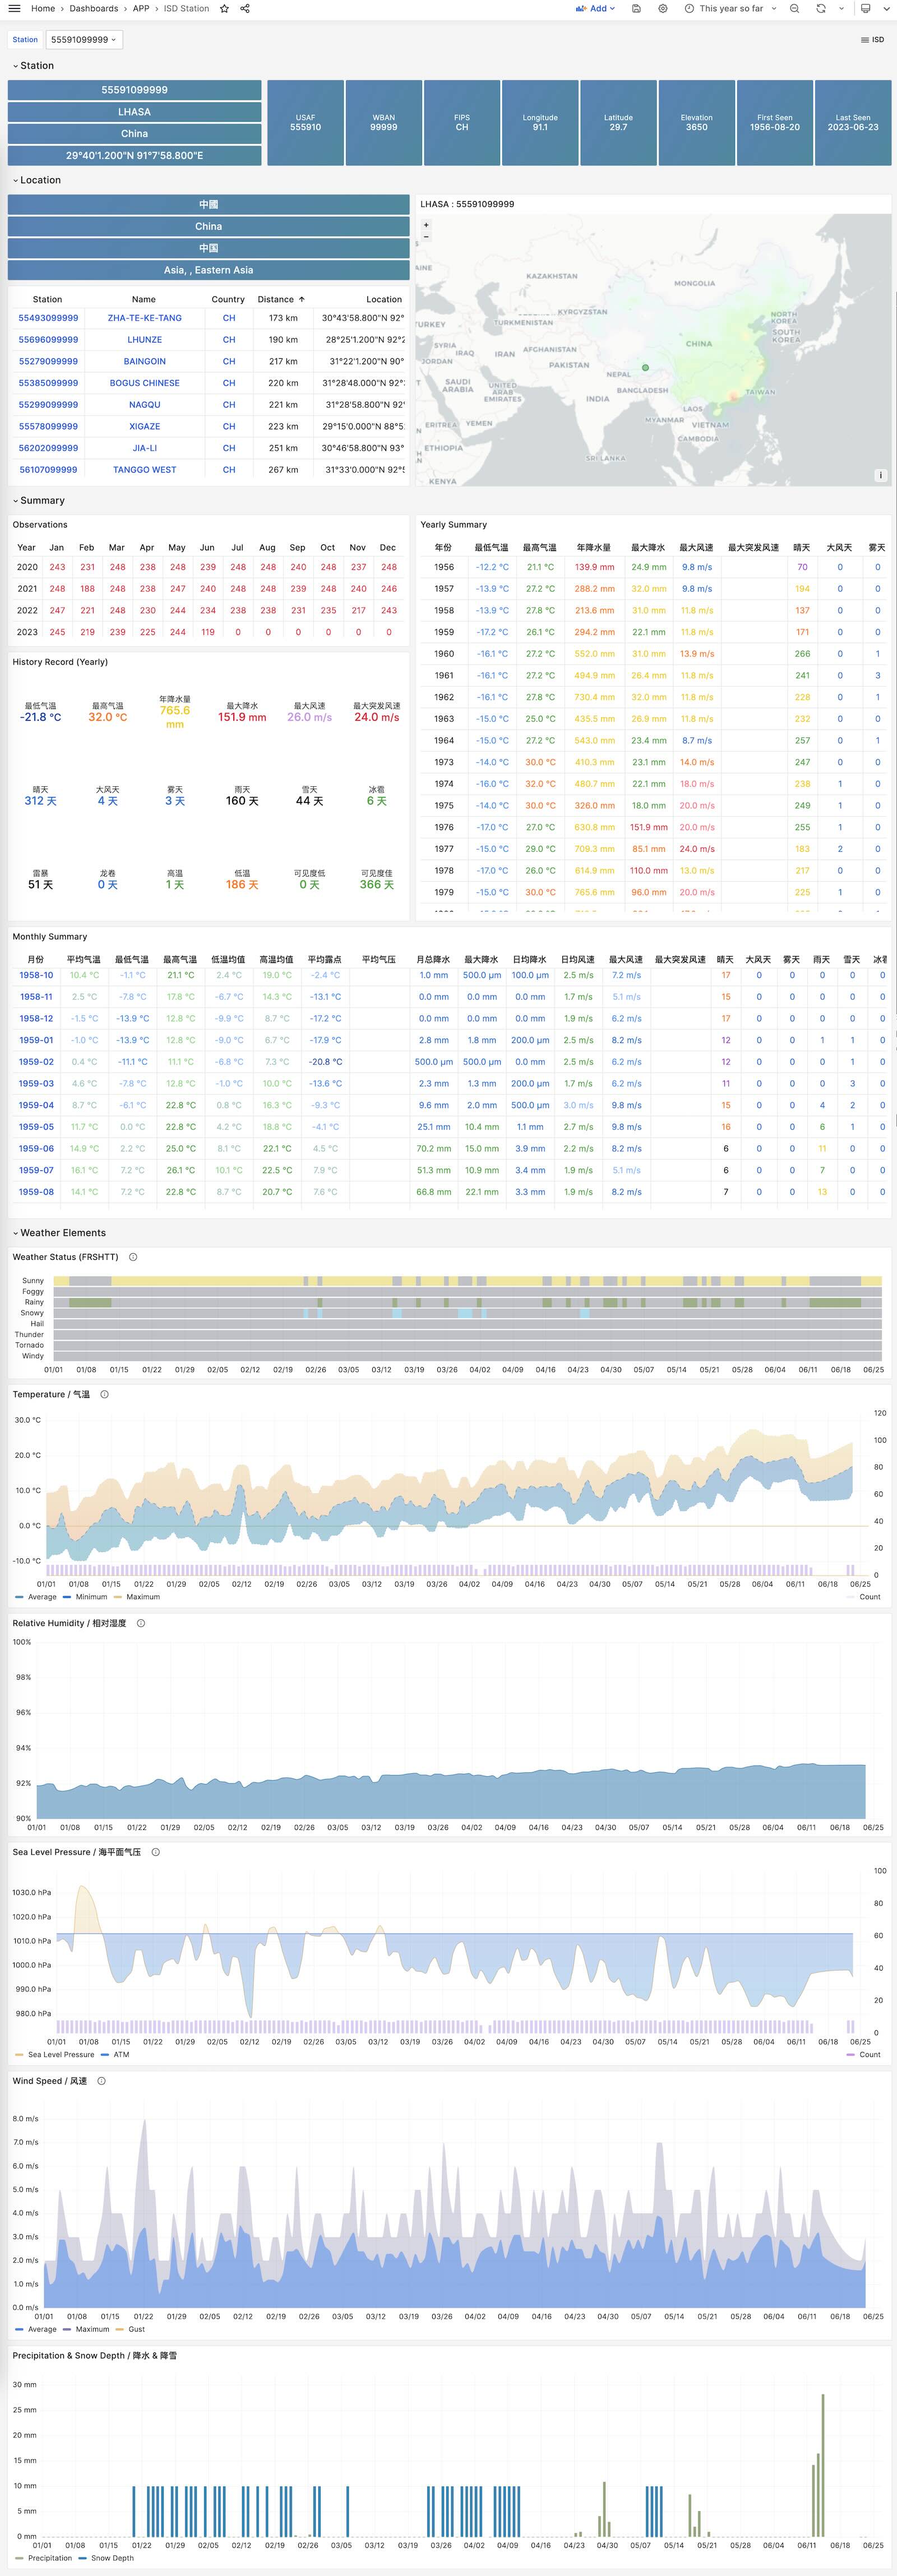
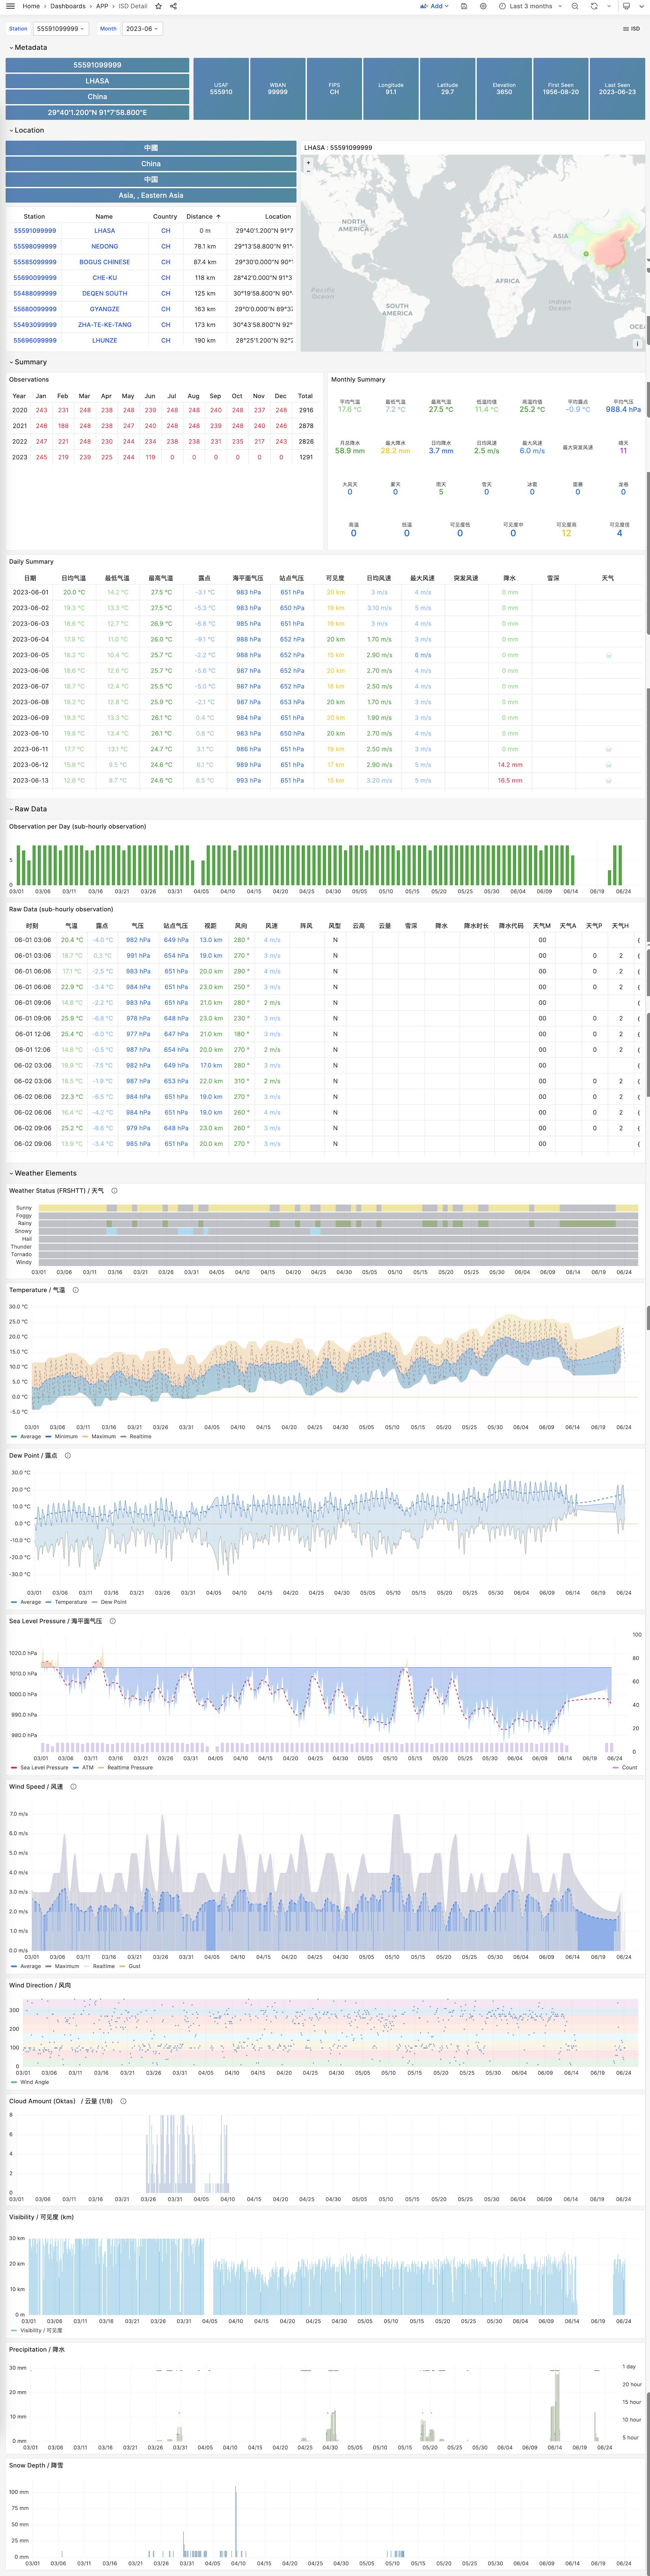
ISD Station
Visualize station metadata and daily/monthly/yearly summary