This is the multi-page printable view of this section. .
Visualization Applet
- 1: Analyse CSVLOG Sample with the built-in PGLOG
- 2: NOAA ISD Station
- 3: WHO COVID-19 Data Analysis
- 4: Solve the 24-Point Card Game with One SQL Statement
- 5: StackOverflow Global Developer Survey
- 6: DB-Engines Database Popularity Trend Analysis
- 7: AWS & Aliyun Server Pricing
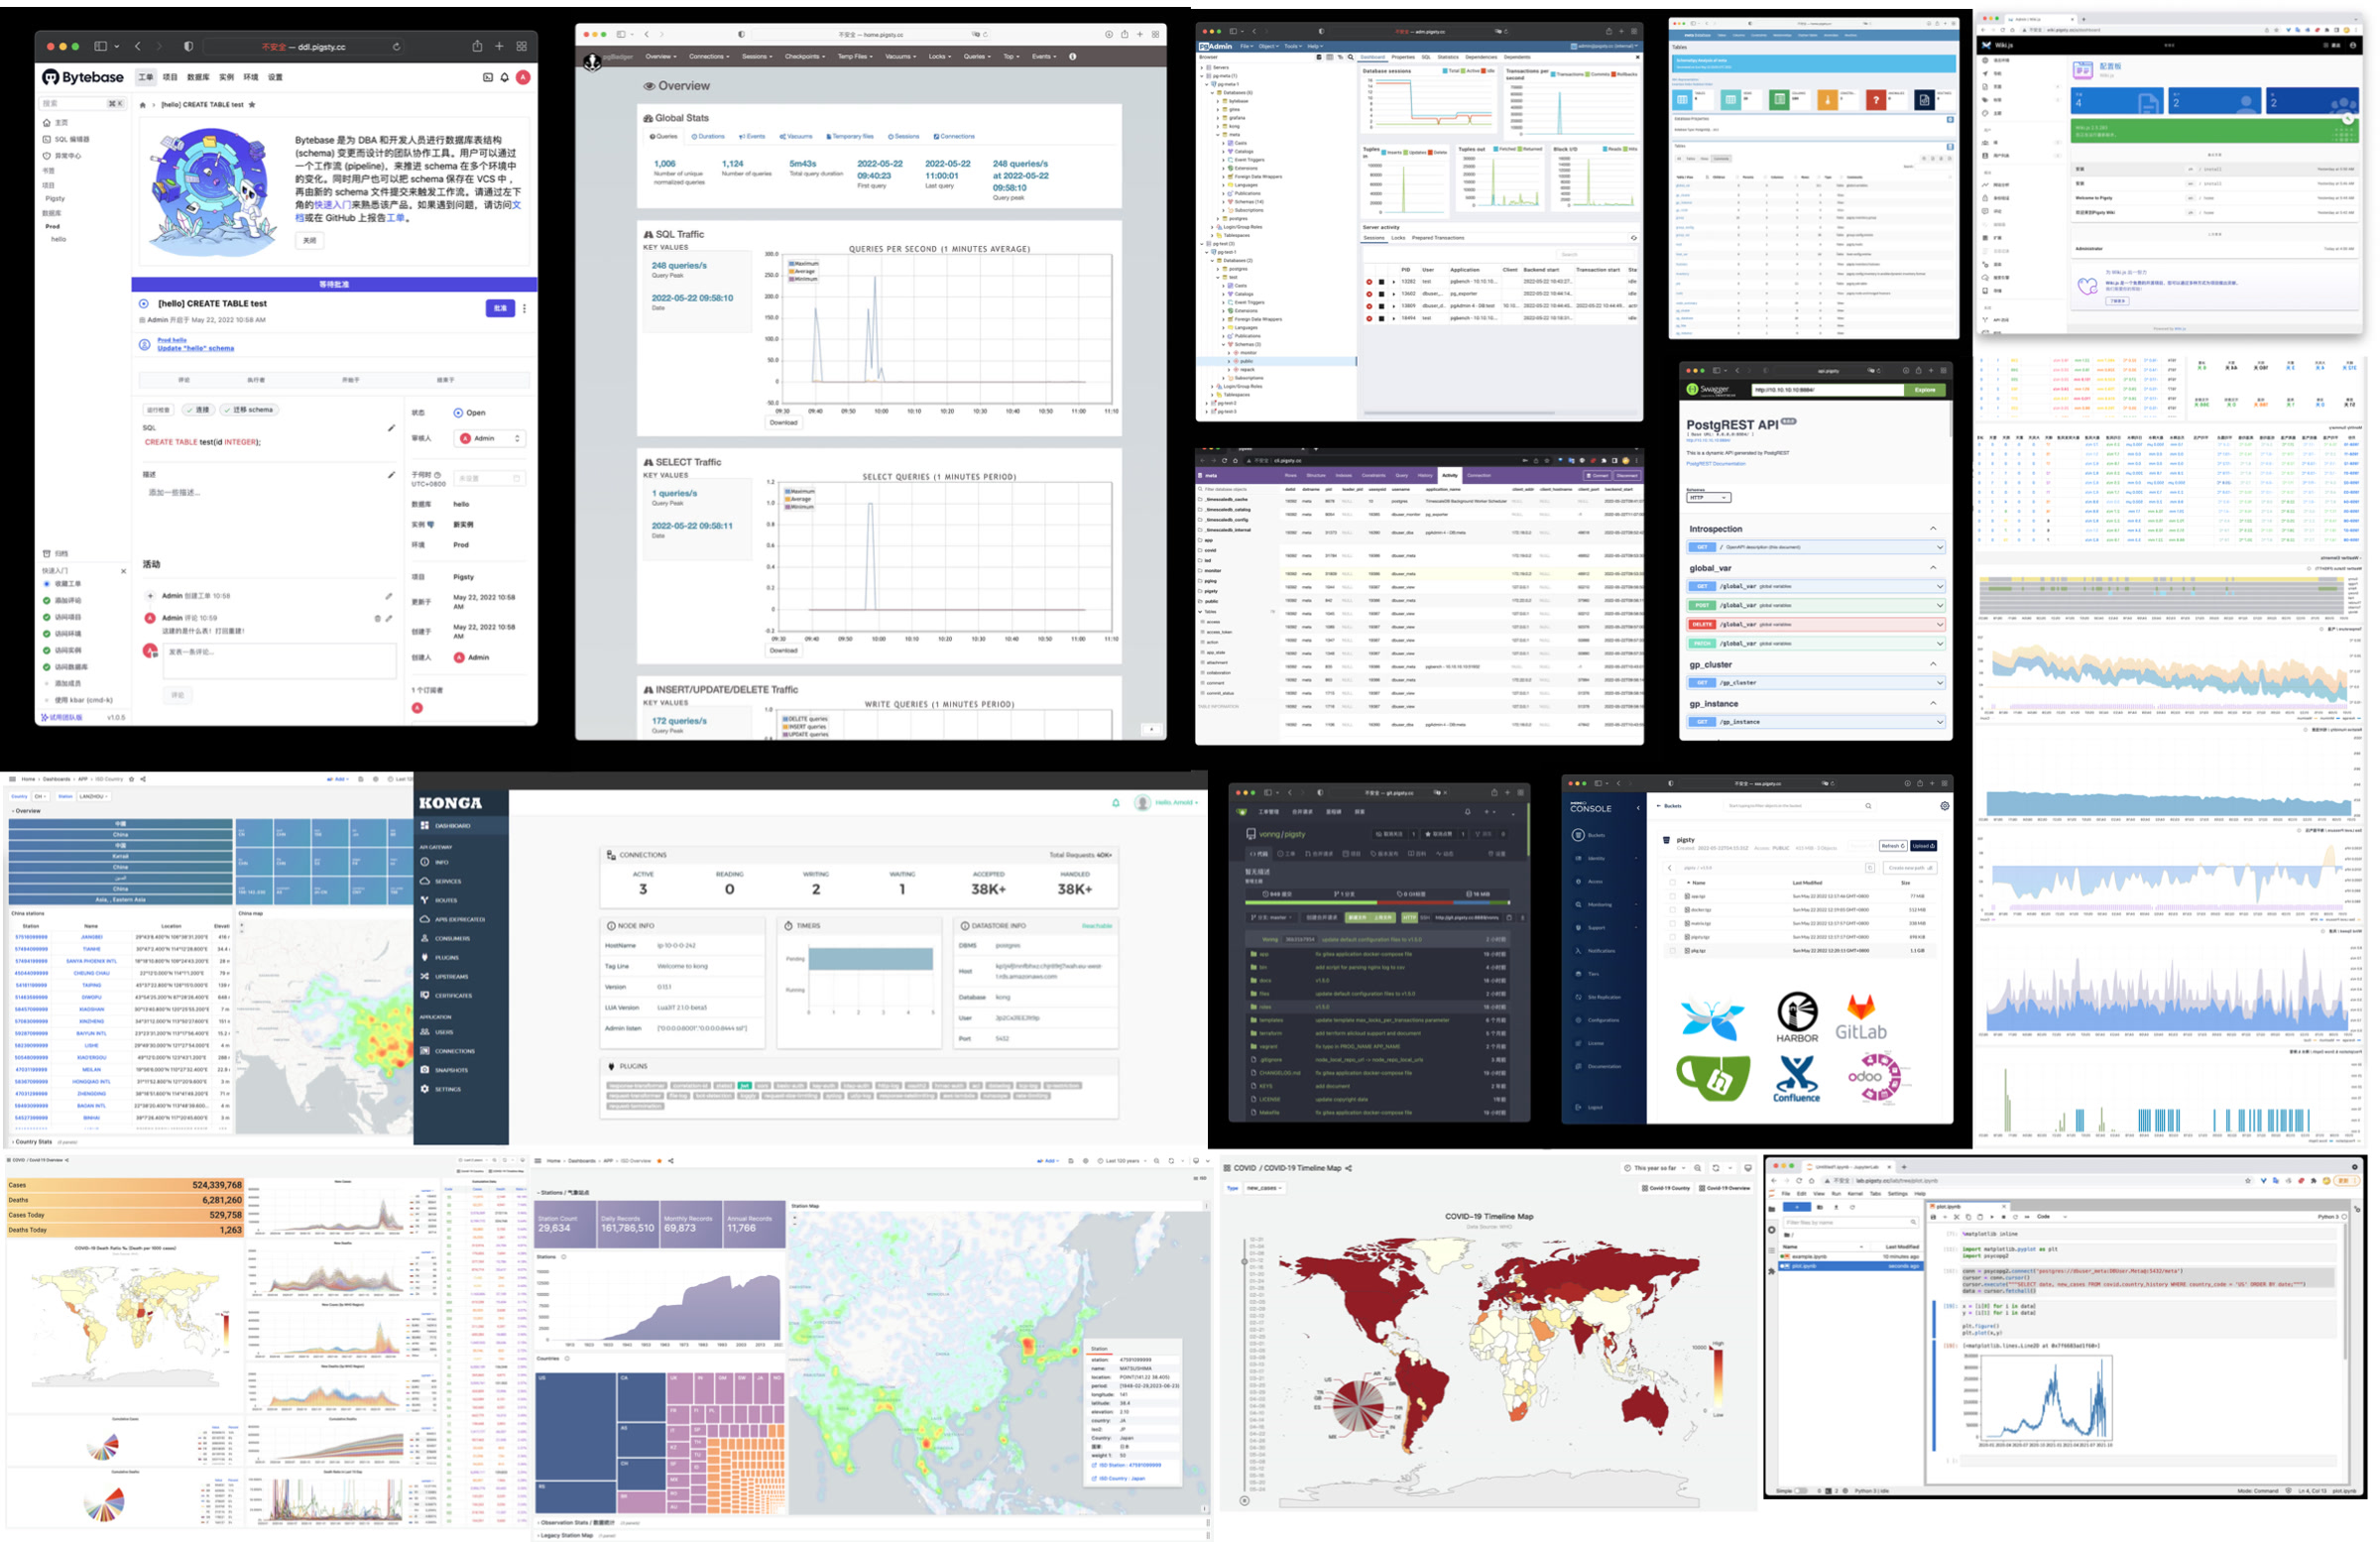
An Applet is a self-contained, data-driven mini-application that runs within the Pigsty infrastructure.
A typical Pigsty application includes at least one or all of the following components:
- Graphical Interface (Grafana Dashboard definitions) located in the
uidirectory - Data Definitions (PostgreSQL DDL Files) located in the
sqldirectory - Data Files (various resources that need to be downloaded) located in the
datadirectory - Logic Scripts (scripts for executing various logic) located in the
bindirectory
Pigsty comes with several sample applications by default:
pglog: Analyzes PostgreSQL CSV log samples.covid: Visualizes WHO COVID-19 data and allows you to check pandemic data by country.isd: NOAA ISD, which provides access to meteorological observation records from 30,000 surface weather stations worldwide since 1901.
Structure
A Pigsty applet provides an installation script in its root directory: install or a related shortcut. You need to run this script as an admin user on the admin node to execute the installation. The installation script will detect the current environment (fetching METADB_URL, PIGSTY_HOME, GRAFANA_ENDPOINT, etc.) to complete the installation.
Typically, dashboards with the APP tag will be listed in the Pigsty Grafana homepage navigation under the Apps dropdown menu, and dashboards with both APP and OVERVIEW tags will be listed in the homepage panel navigation.
1 - Analyse CSVLOG Sample with the built-in PGLOG
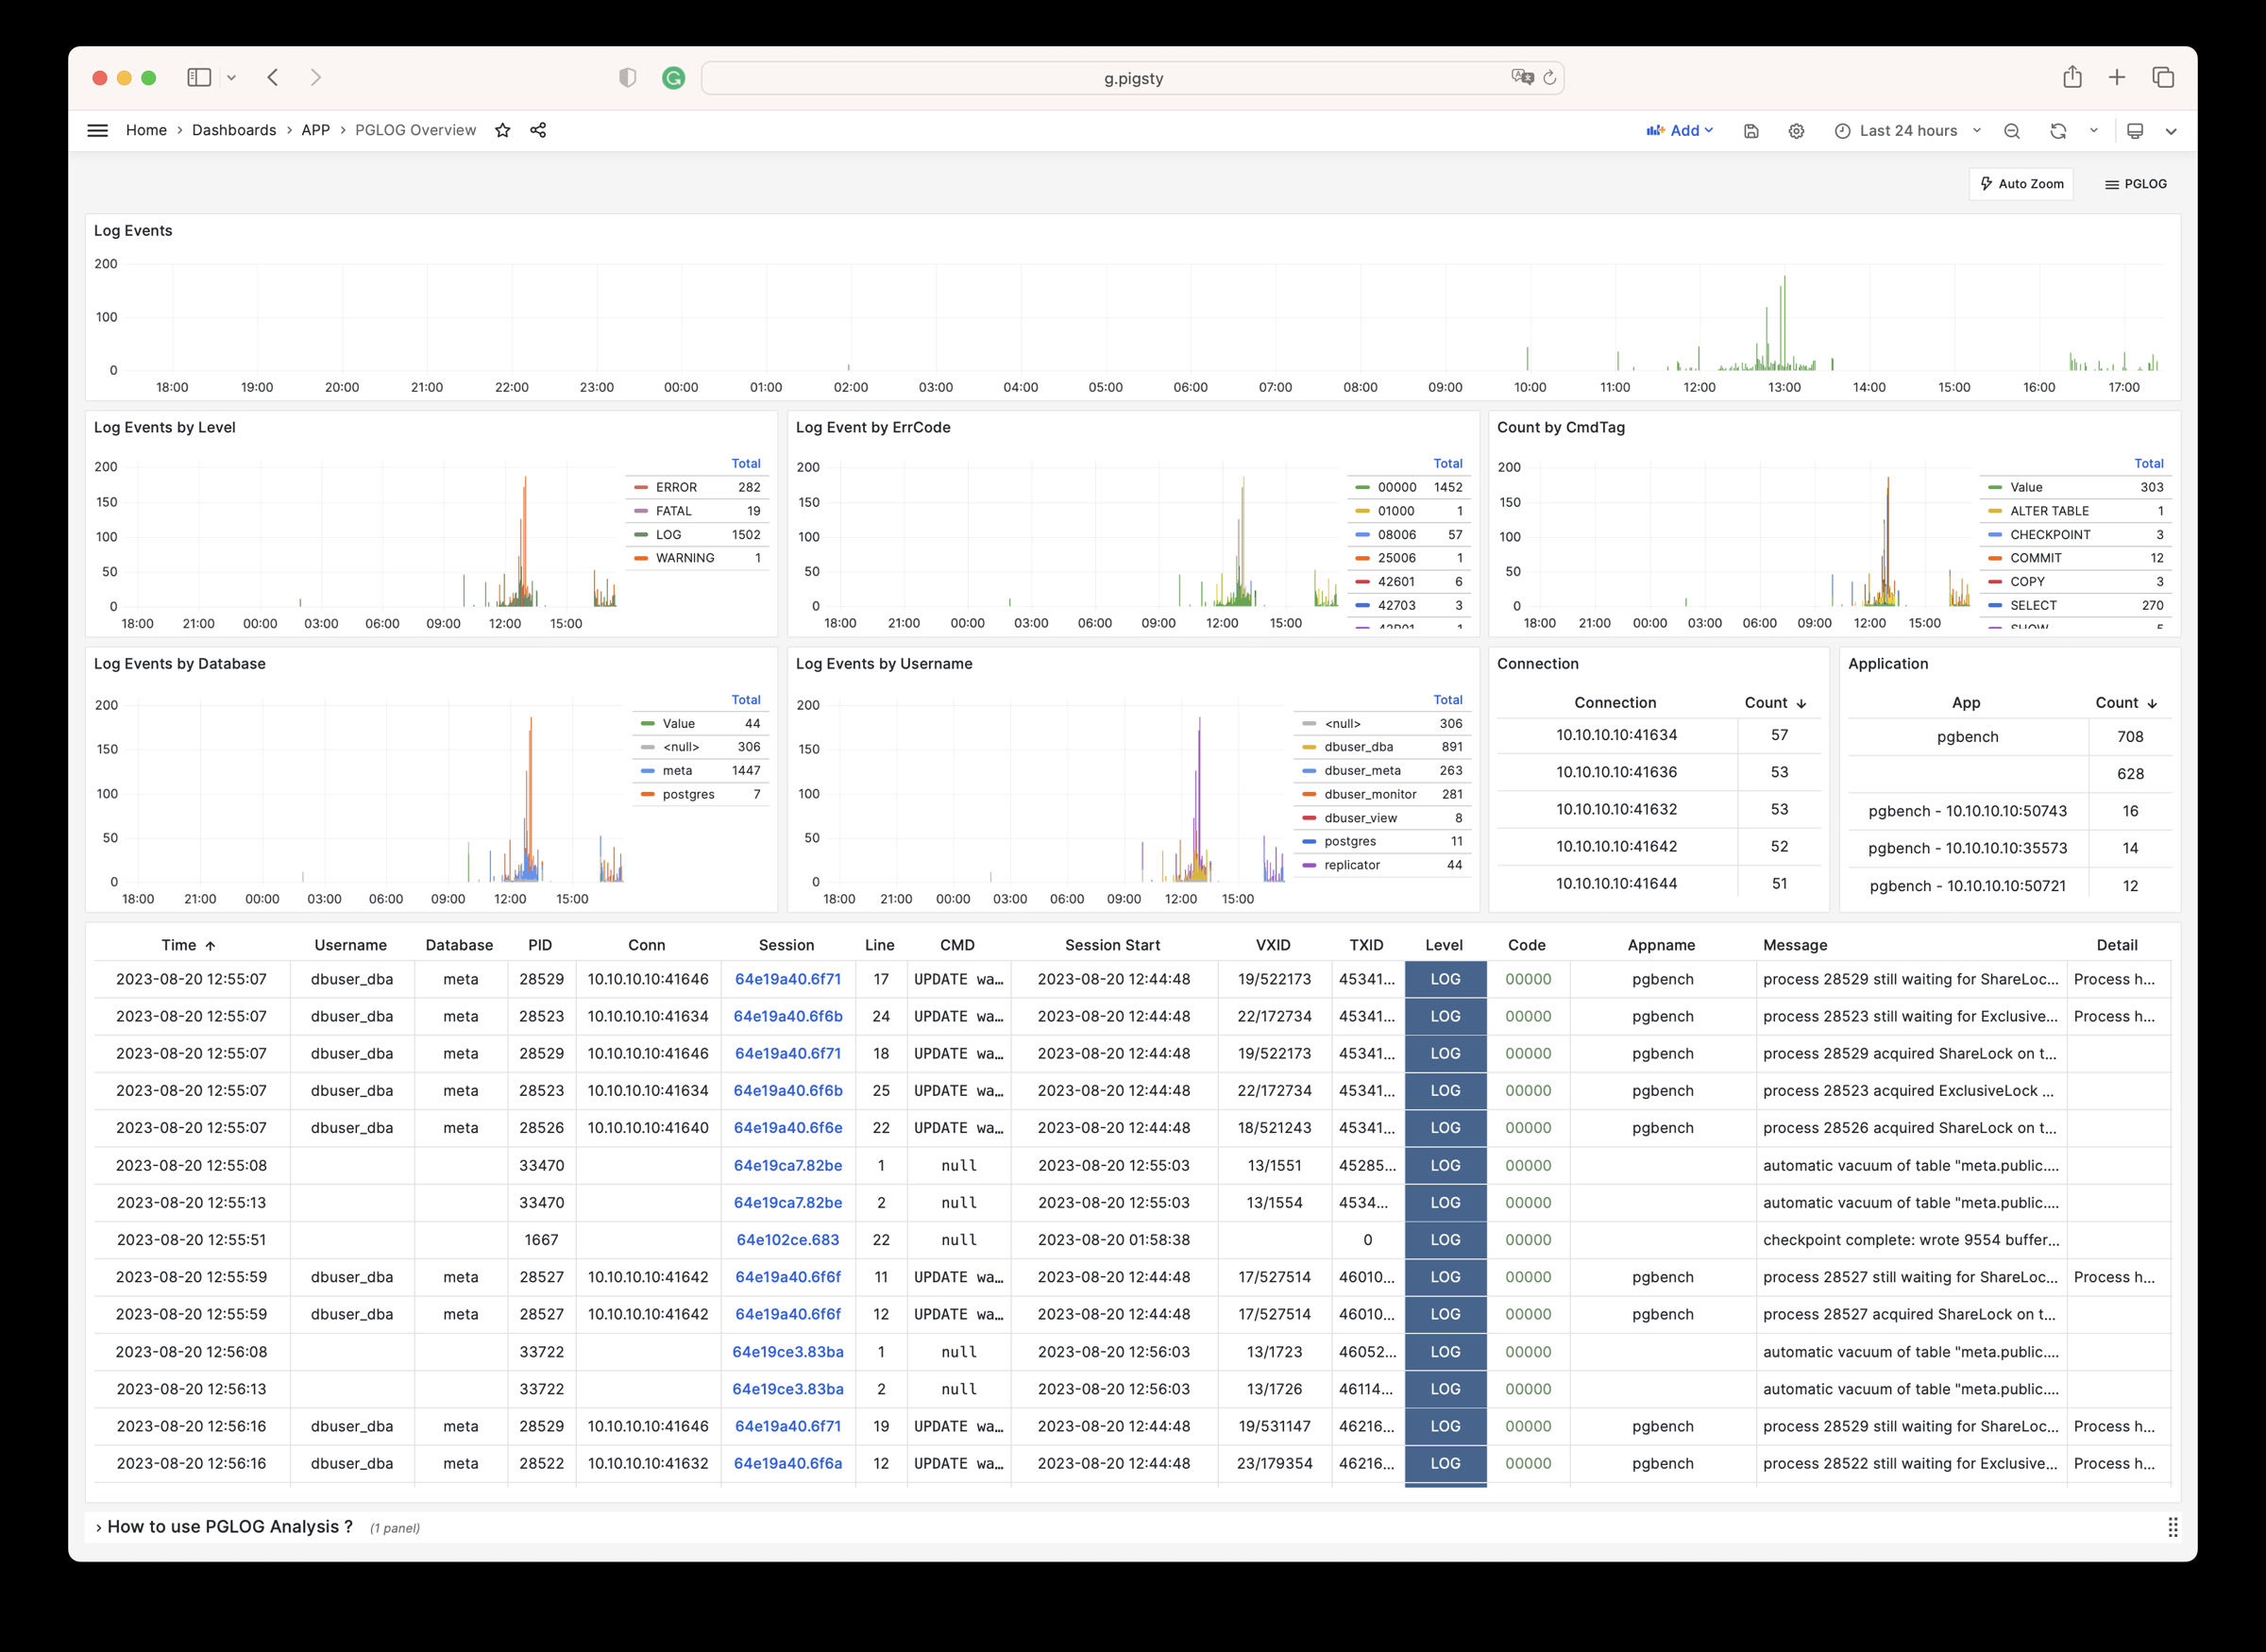
PGLOG is a sample application included with Pigsty that uses the pglog.sample table in MetaDB as the data source.
Simply populate this table with logs and access the corresponding Dashboard.
Pigsty provides some handy commands to fetch CSV logs and load them into the sample table. The following shortcut commands are available on the master node by default:
Next, you can visit the following links to view sample log analysis dashboards:
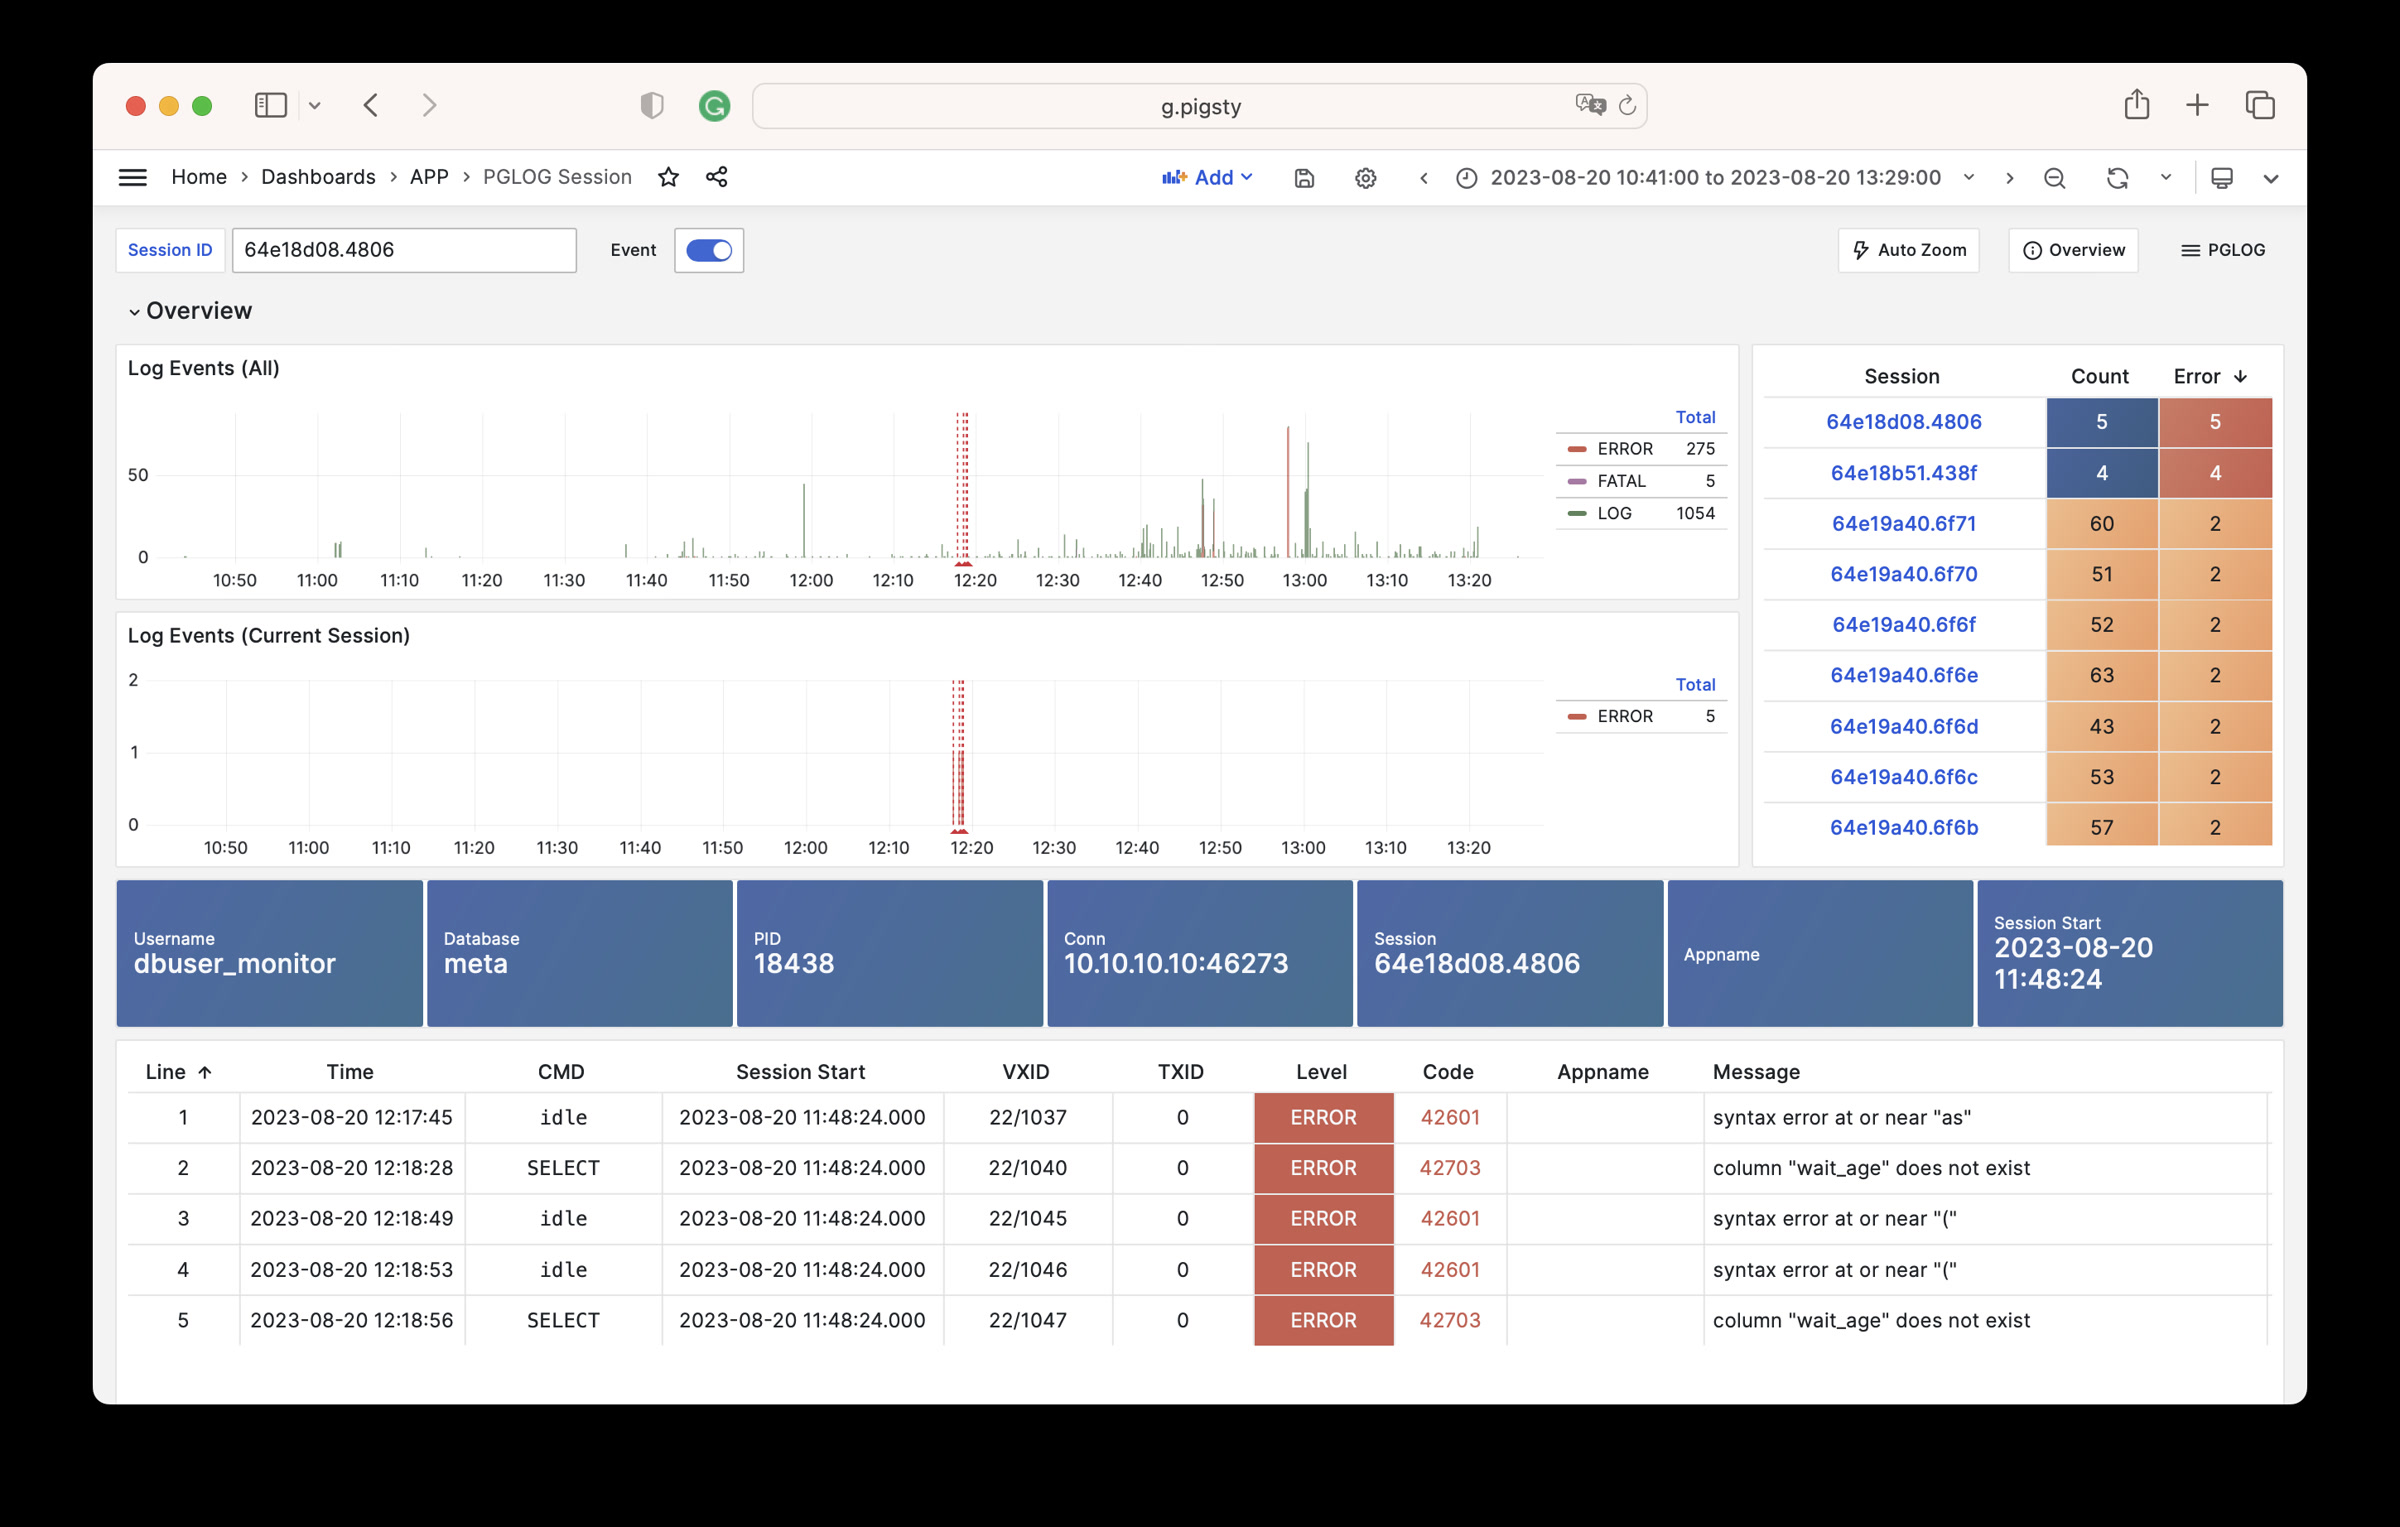
The catlog command fetches CSV database logs from a specific node for a specific date and writes them to stdout.
By default, catlog fetches logs of the current node for today, but you can specify the node and date via parameters.
By combining pglog and catlog, you can quickly fetch and analyze database CSV logs.
2 - NOAA ISD Station
Including 30000 meteorology station, daily, sub-hourly observation records, from 1900-2023. https://github.com/Vonng/isd
It is recommended to use with Pigsty, the battery-included PostgreSQL distribution with Grafana & echarts for visualization. It will setup everything for your with make all;
Otherwise, you’ll have to provide your own PostgreSQL instance, and setup grafana dashboards manually.
Quick Start
Clone this repo
Prepare a PostgreSQL Instance
Export PGURL in your environment to specify the target postgres database:
then init database schema with:
Get isd station metadata
The basic station metadata can be downloaded and loaded with:
Fetch and load isd.daily
To load isd.daily dataset, which is organized by yearly tarball files.
You can download the raw data from noaa and parse with isd parser
Load Parsed Stable CSV Data
Or just load the pre-parsed stable part from GitHub. Which is well-formatted CSV that does not require an isd parser.
More Data
There are two parts of isd datasets needs to be regularly updated: station metadata & isd.daily of the latest year, you can reload them with:
You can download and load isd.daily in a specific year with:
You can also download and load isd.hourly in a specific year with:
Data
Dataset
There are four official datasets
| Dataset | Sample | Document | Comments |
|---|---|---|---|
| ISD Hourly | isd-hourly-sample.csv | isd-hourly-document.pdf | (Sub)Hour observation records |
| ISD Daily | isd-daily-sample.csv | isd-daily-format.txt | Daily summary |
| ISD Monthly | N/A | isd-gsom-document.pdf | Not used, Generate from isd.daily |
| ISD Yearly | N/A | isd-gsoy-document.pdf | Not used, Generate from isd.daily |
Daily Dataset
- Tarball size 2.8GB (until 2023-06-24)
- Table size 24GB, Index size 6GB, Total size in PostgreSQL = 30GB
- If timescaledb compression is used, it will be compressed to around 4.5GB
Hourly dataset
- Tarball size 117GB
- Table size 1TB+ , Index size 600GB+
Schema
- sql/1_schema.sql : isd schema
- sql/2_record.sql : daily, monthly, yearly table schema
- sql/3_hourly.sql : optional hourly data schema
- sql/4_data.sql : dict, map, country data
ISD Hourly
Parser
There are two parsers: isdd and isdh, which takes noaa original yearly tarball as input, generate CSV as output (which could be directly consumed by PostgreSQL COPY command).
UI
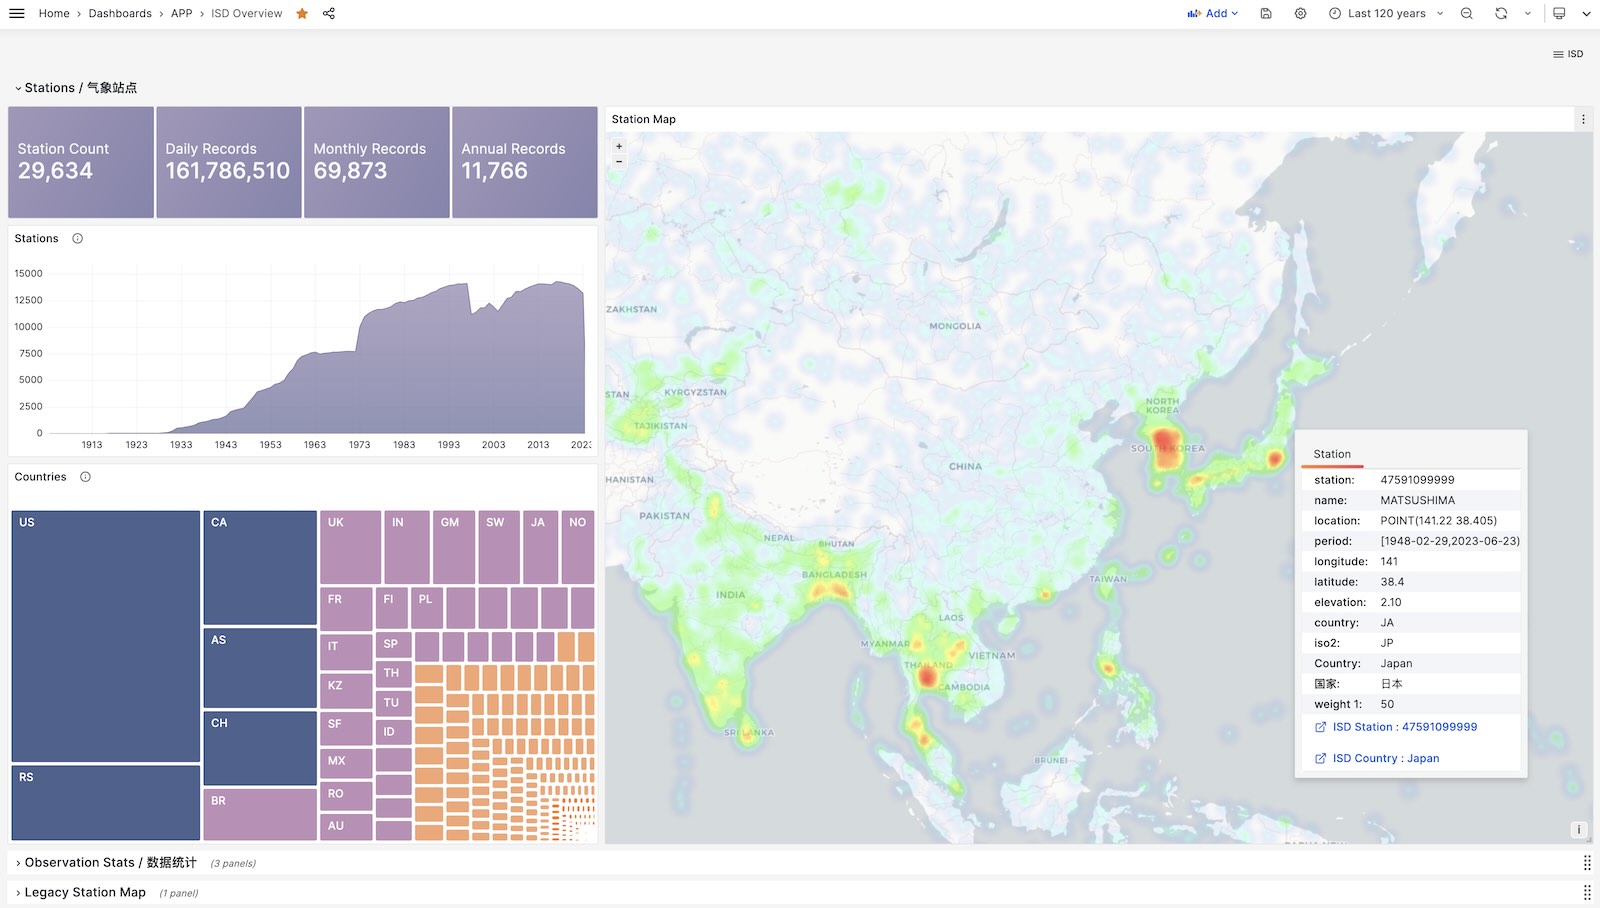
ISD Overview
Show all stations on a world map.
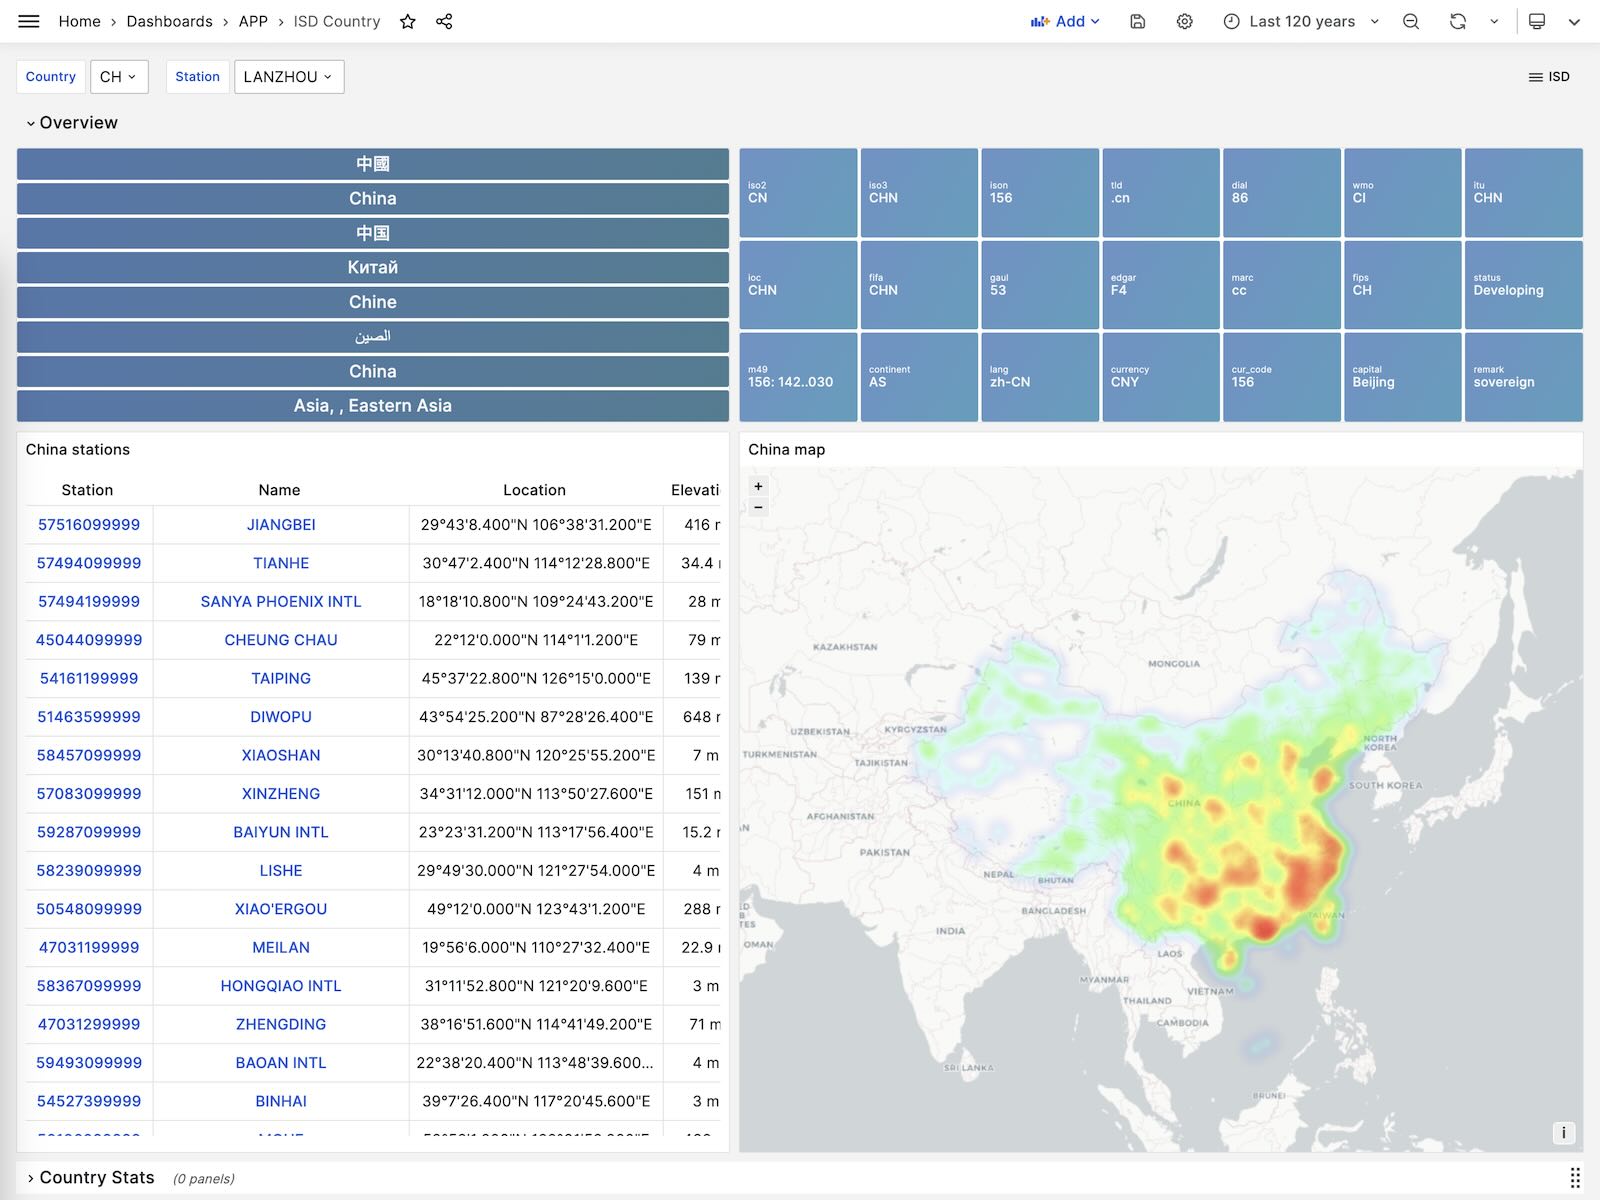
ISD Country
Show all stations among a country.
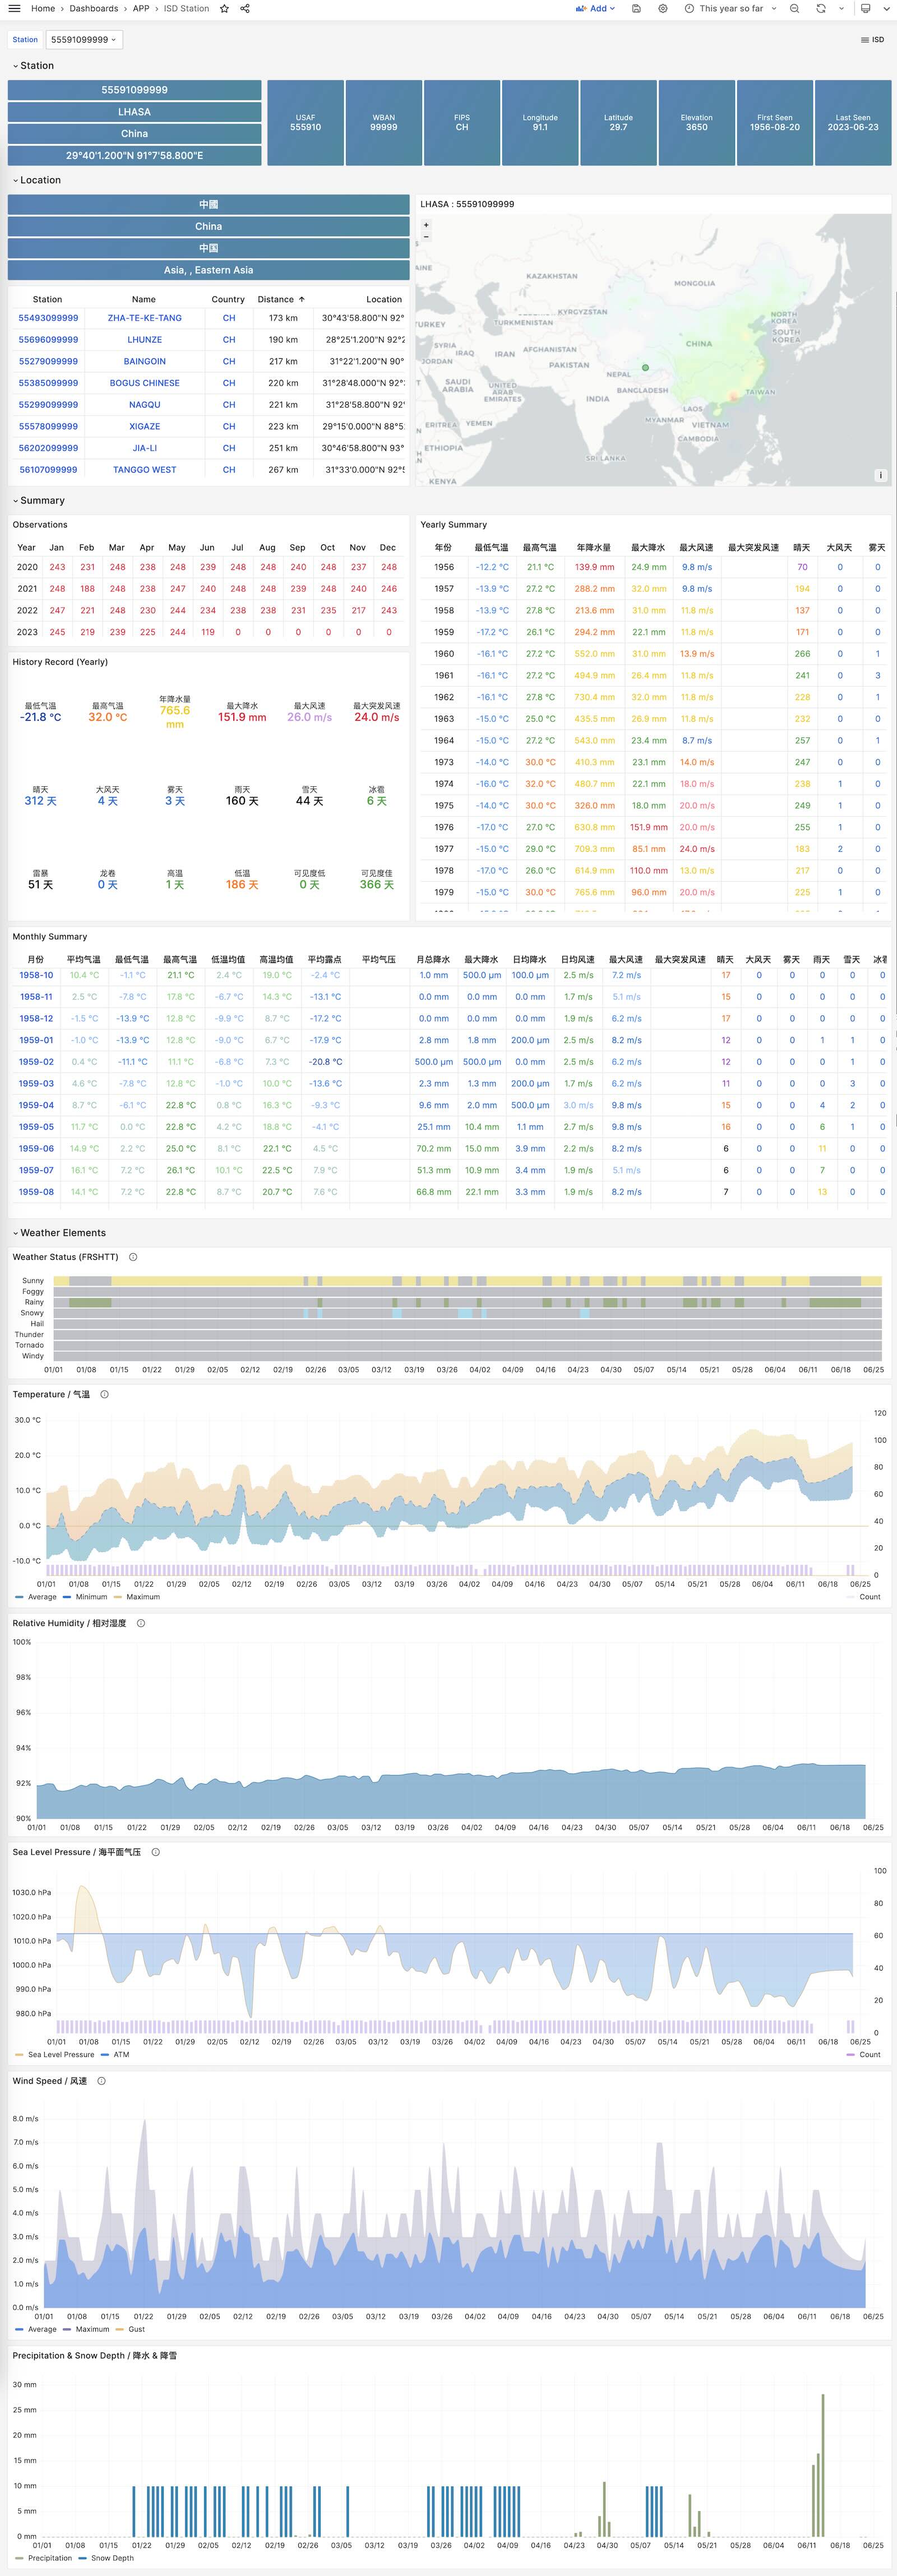
ISD Station
Visualize station metadata and daily/monthly/yearly summary
ISD Station Dashboard
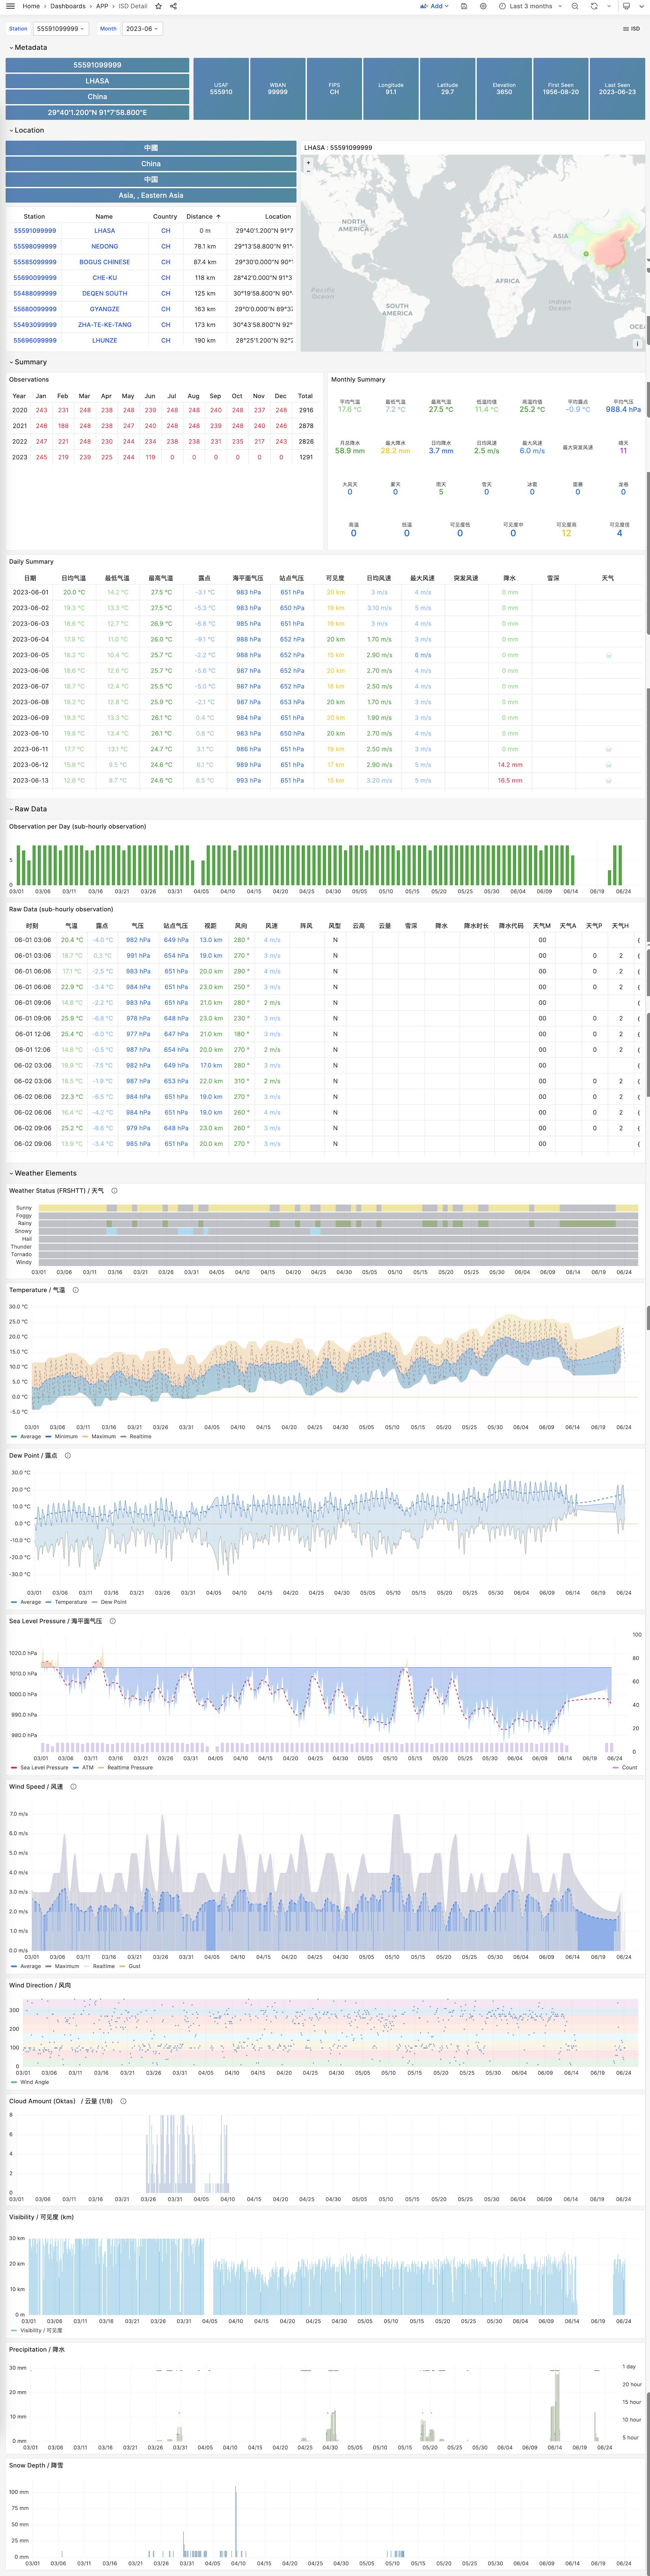
ISD Detail
Visualize hourly observation raw metrics.
ISD Station Dashboard
License
3 - WHO COVID-19 Data Analysis
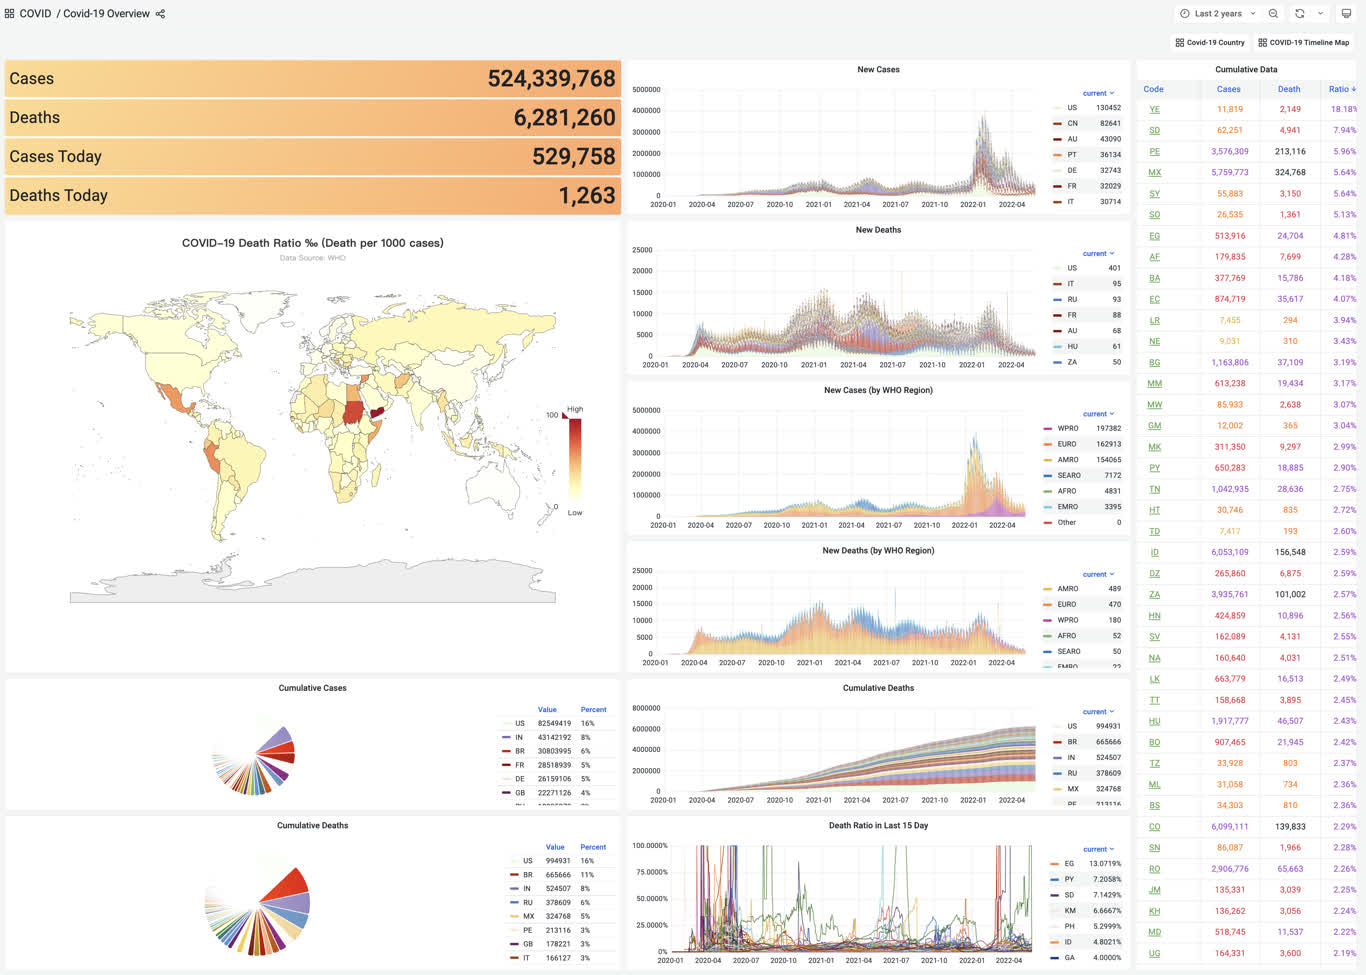
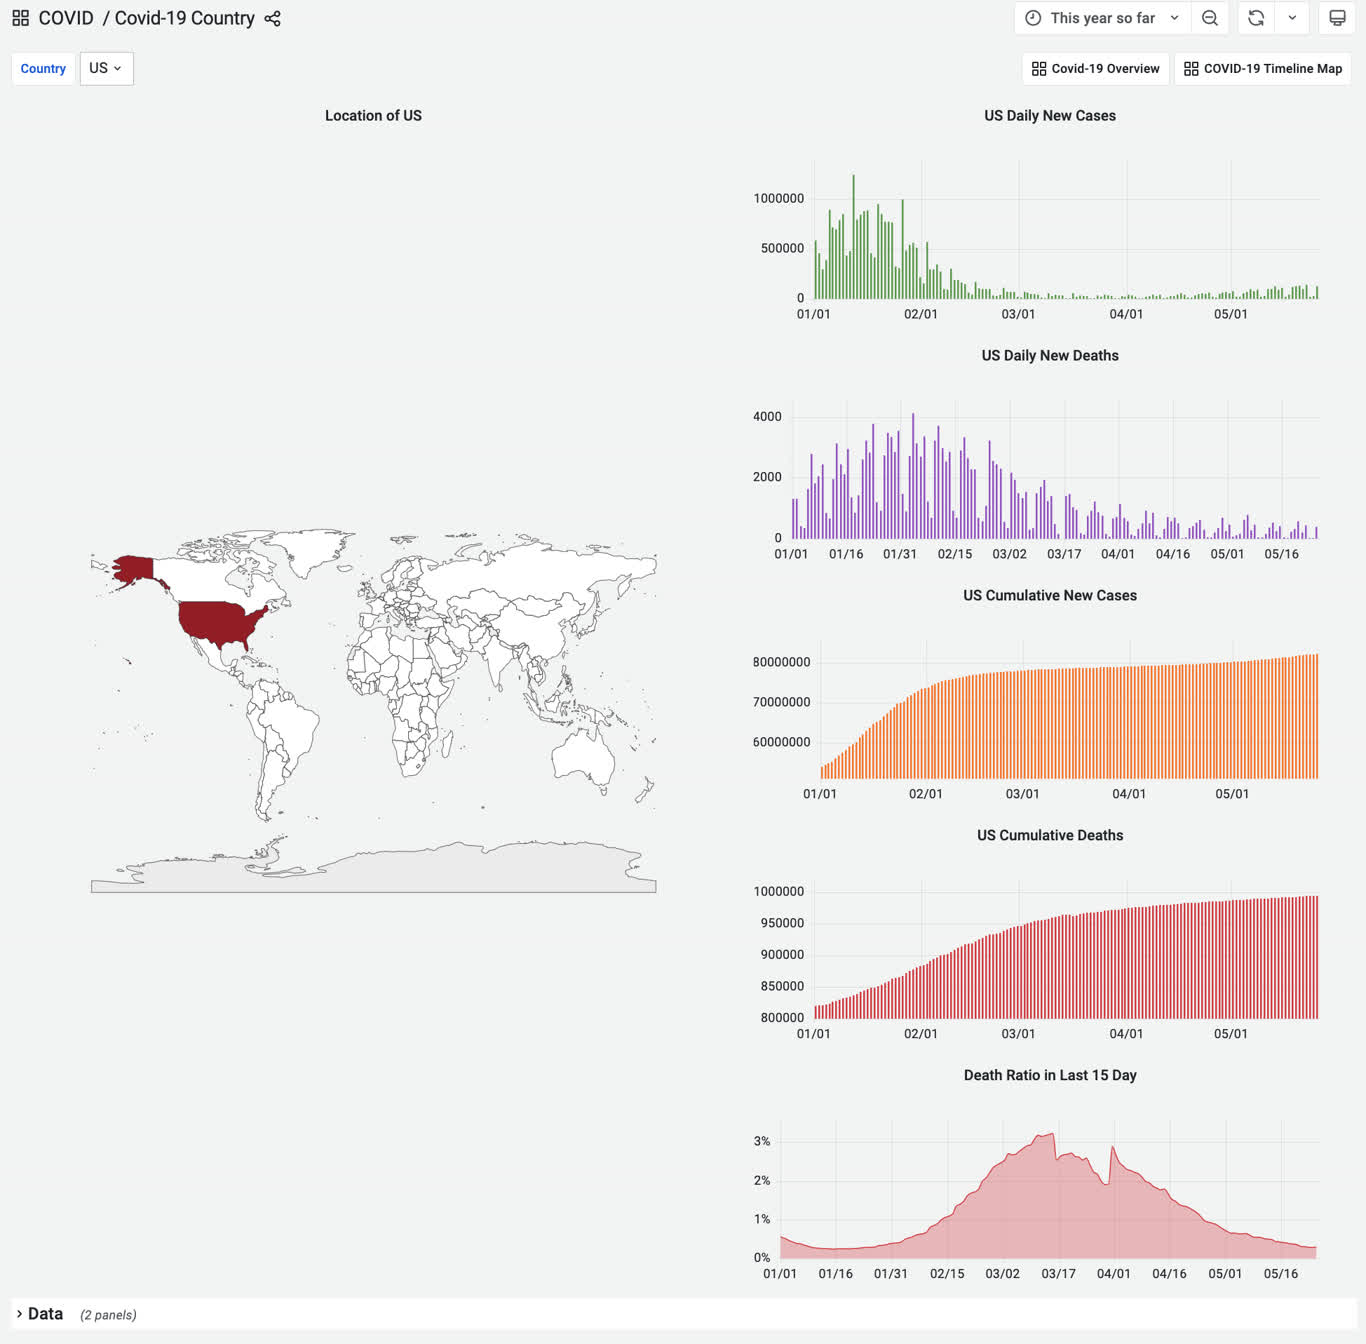
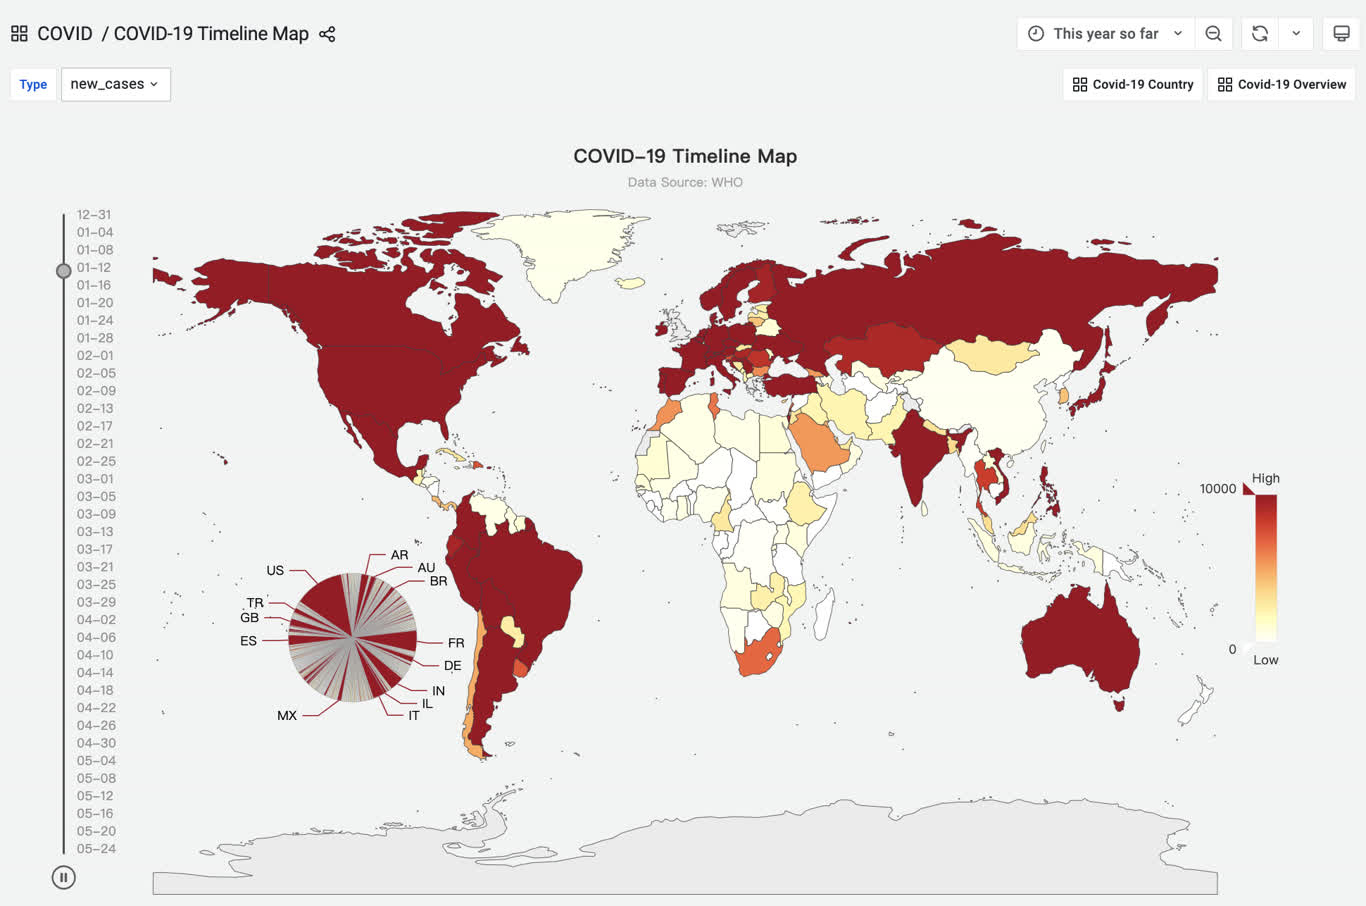
The on-line demo:https://demo.pigsty.cc/d/covid-overview
Installation
在管理节点上进入应用目录,执行make以完成安装。
其他一些子任务:
Dashboards
4 - Solve the 24-Point Card Game with One SQL Statement
Problem
The challenge is described in Database Programming Contest: Calculate 24 with One SQL Statement.
A cards table has an auto-incrementing id and four columns, c1 through c4; each card is a random integer from 1 to 10. One SQL statement must return a valid arithmetic expression whose result is 24, or NULL when no solution exists.
The rules allow only addition, subtraction, multiplication, division, and parentheses. Every input number must be used exactly once. Built-in database functions are allowed, but stored procedures, user-defined functions, and code blocks are not. The submitted SQL must be smaller than 10 KB and was evaluated on a 4-core, 32 GB server.
Prime-number lookup is the fastest general approach, but the complete lookup text is slightly larger than 10 KB. MySQL provides built-in COMPRESS and UNCOMPRESS; PostgreSQL uses the pgsql-gzip extension for the compressed variant. The following is the PostgreSQL solution.
Create Random Test Data
Prime-Encoded Lookup Solution
The core idea assigns each card value a prime number. The product of four primes is an order-independent key, so every solvable multiset can be joined to one precomputed expression in constant time.
The uncompressed SQL is 10,896 characters. Converting repeated logic into an inline function or using hexadecimal keys can reduce it, but the contest rules disallow stored procedures, so the large lookup string is the main compression target.
Compressed Variant
Pigsty provides the pgsql-gzip extension used by this historical solution:
Compressing the lookup table reduces its 10,018 characters to 7,796 and the complete statement to 8,796 characters, within the contest limit:
Result
On a local M1 MacBook Pro, single-core execution took about 0.58 seconds, slightly faster than the winning 0.67-second result. The contest PostgreSQL instance did not provide the gzip extension, so this compressed form was not submitted there.
This demonstrates a one-statement PostgreSQL solution to the 24-point card game. Parallel execution could improve it further; a PostgreSQL-specific alternative would be a C extension exposing the lookup as a function, although that would fall outside the contest rules.
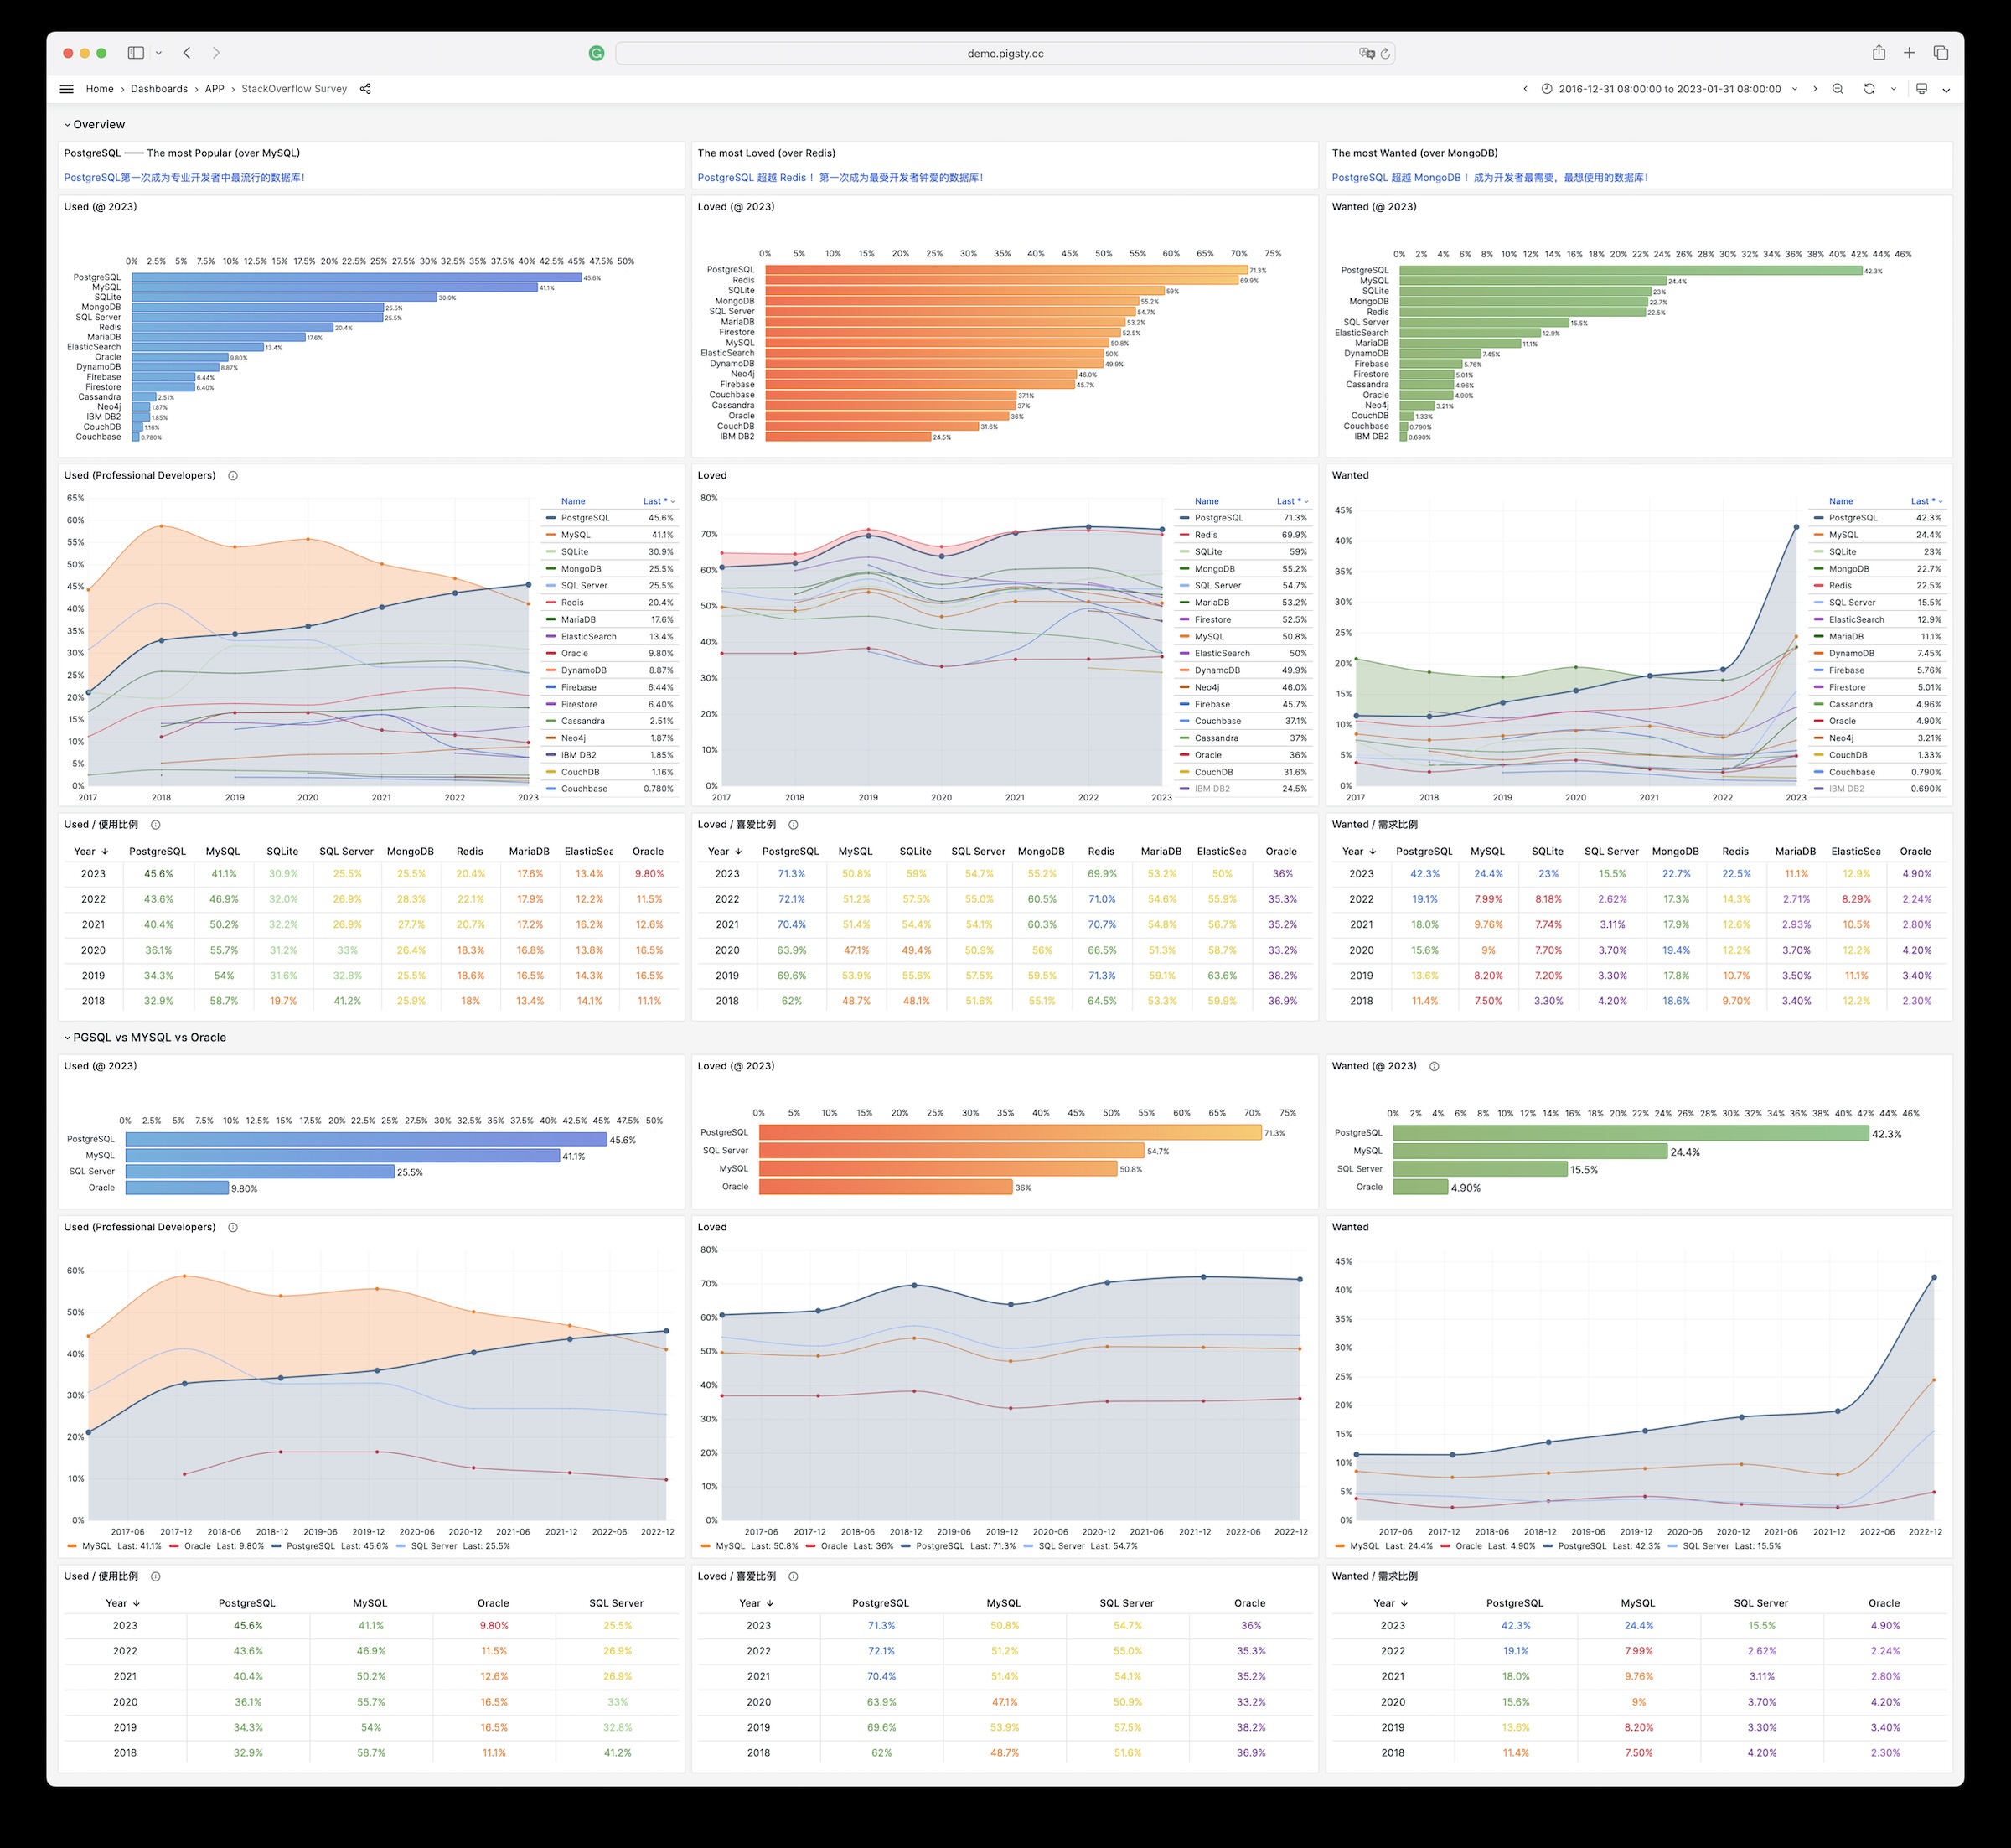
5 - StackOverflow Global Developer Survey
Overview
GitHub Repository: https://github.com/Vonng/pigsty-app/tree/11fbbc03031b0a060cf4da0f87f3f12a4ec2f126/db
Online Demo: https://demo.pigsty.io/d/sf-survey
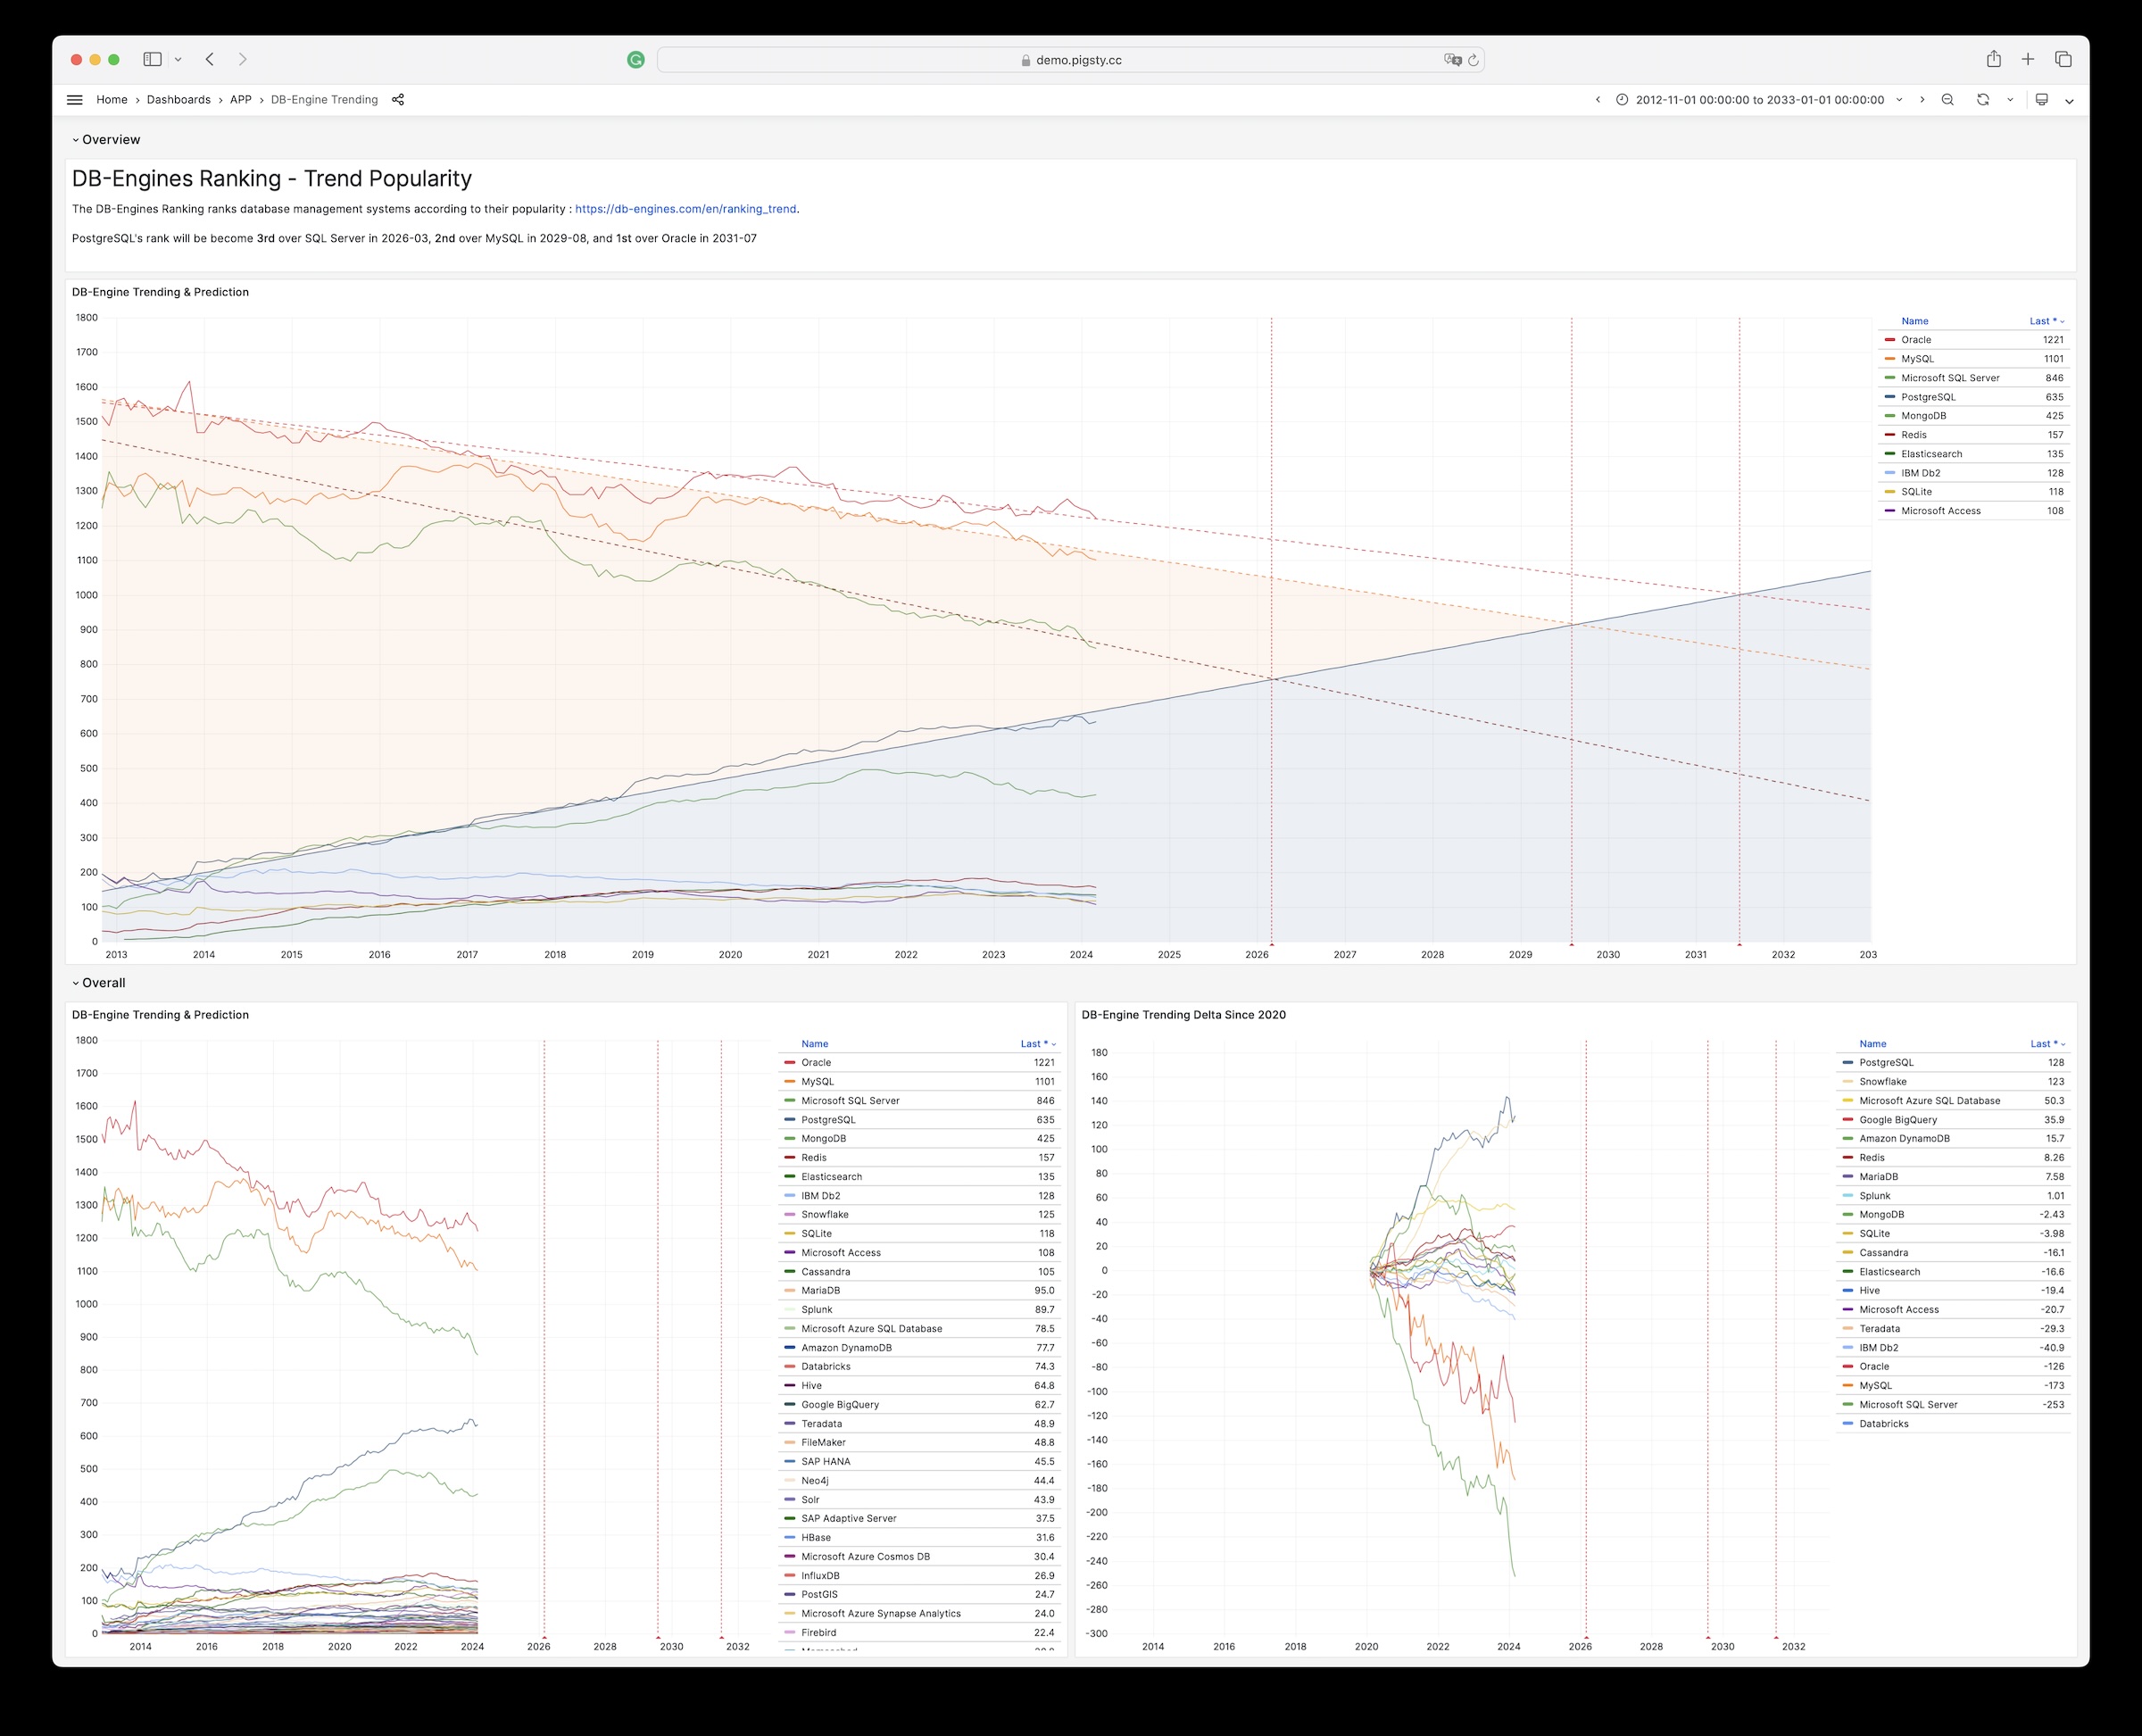
6 - DB-Engines Database Popularity Trend Analysis
Overview
GitHub Repository: https://github.com/Vonng/pigsty-app/tree/11fbbc03031b0a060cf4da0f87f3f12a4ec2f126/db
Online Demo: https://demo.pigsty.io/d/db-engine
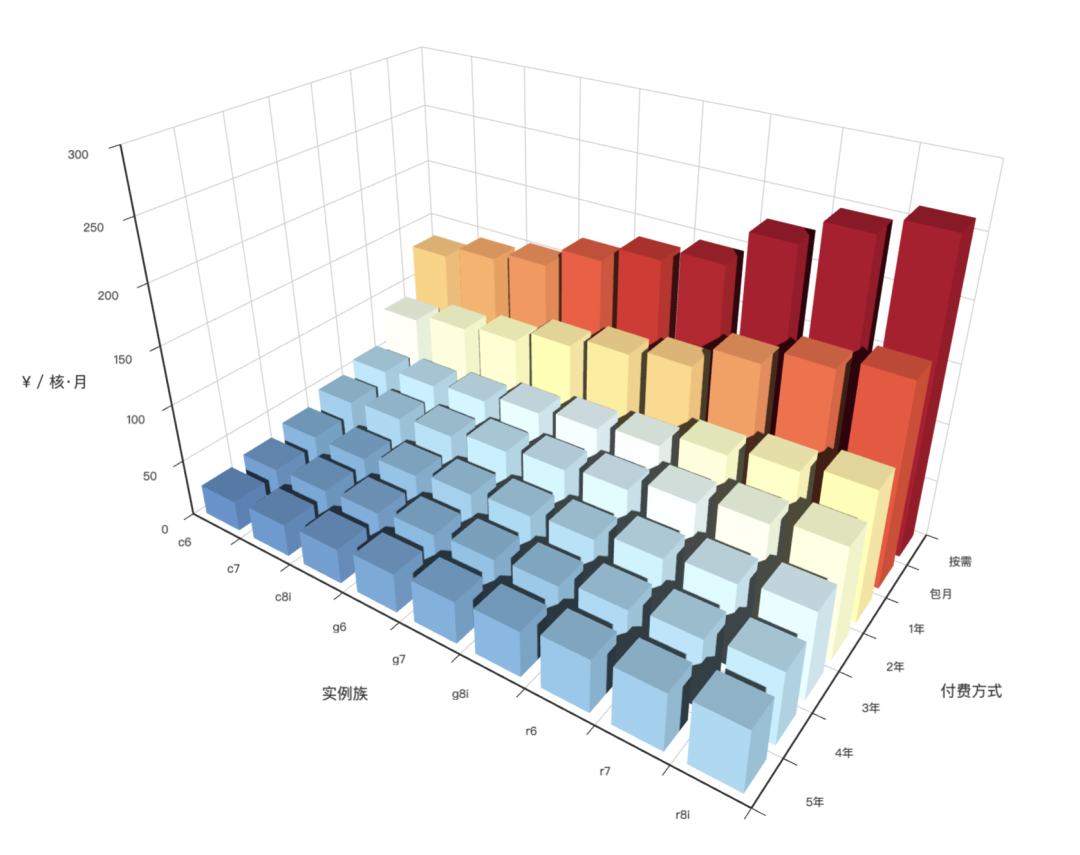
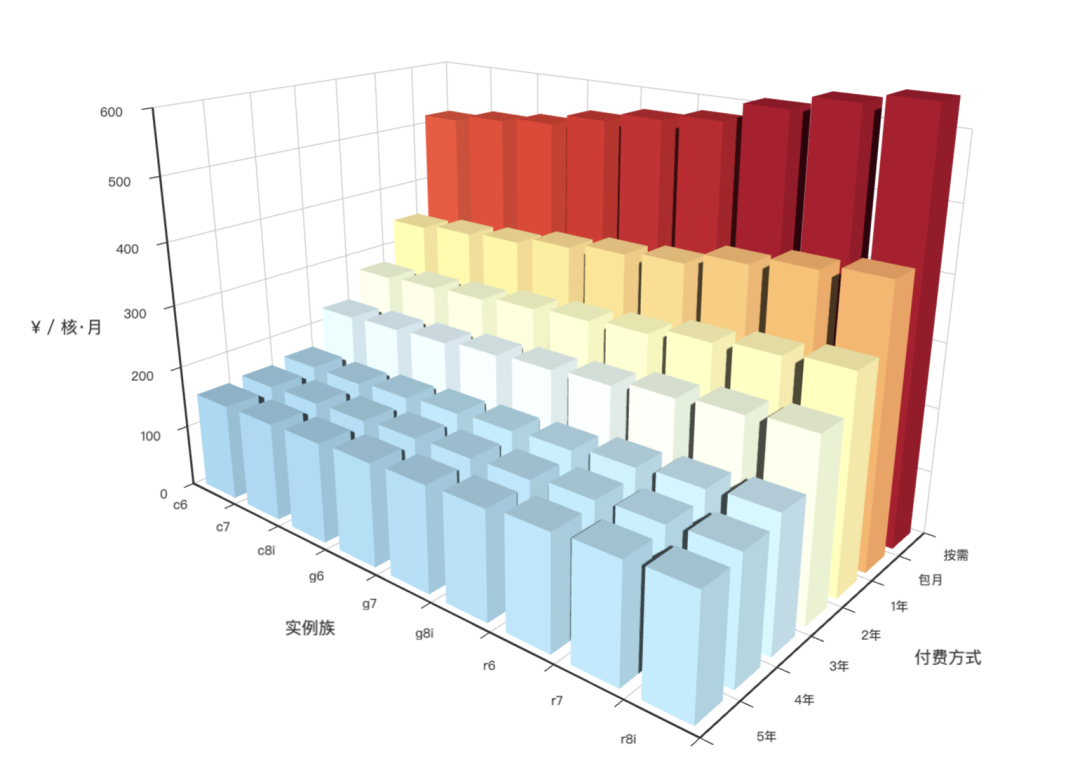
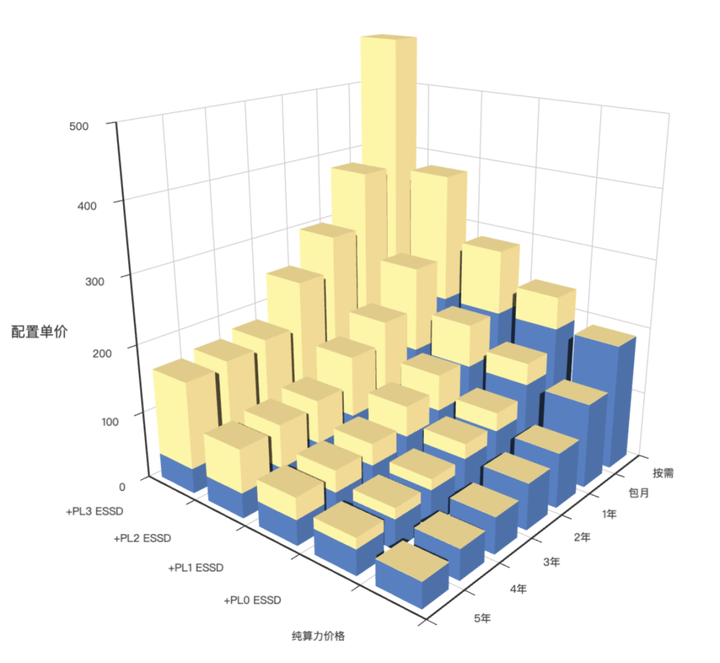
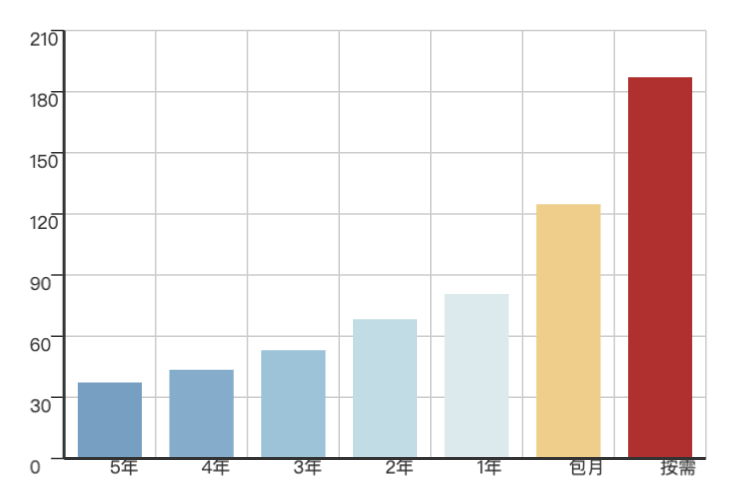
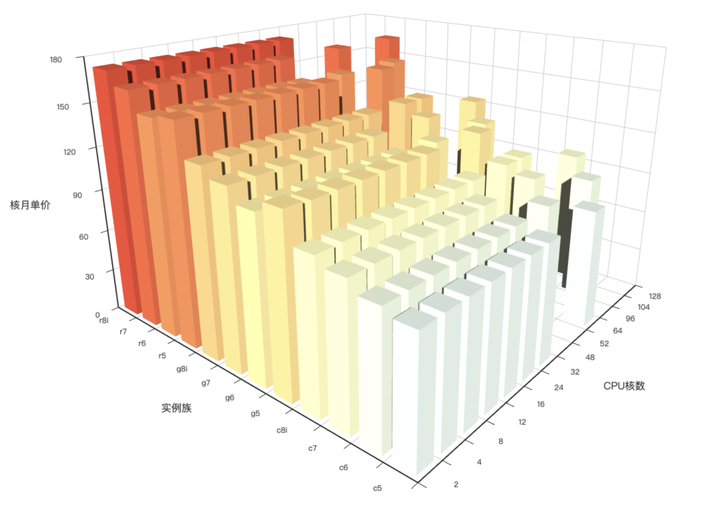
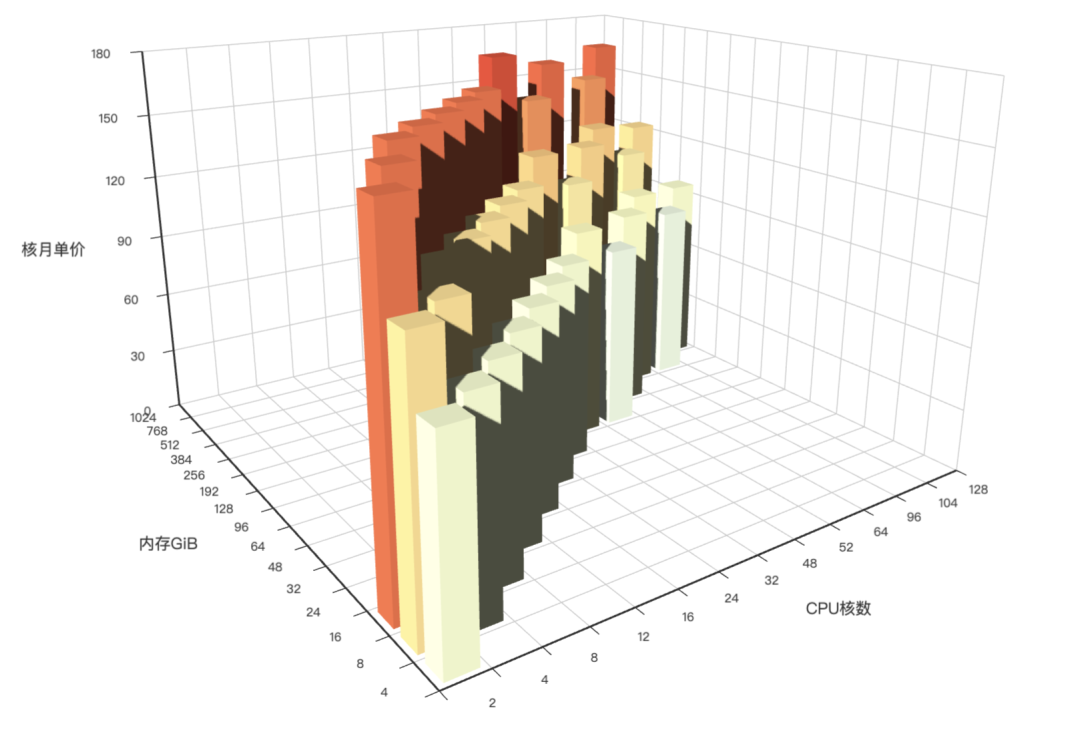
7 - AWS & Aliyun Server Pricing
Overview
Historical source note: the advertised pigsty-app/cloud directory was not present in the last immutable app repository snapshot before v2.7.0; the SQL and recovered images below come from the frozen documentation repository.
Online Demo: https://demo.pigsty.io/d/ecs
Article: Analyzing Computing Costs: Has Aliyun Really Reduced Prices?
Data Source
Aliyun ECS pricing can be obtained as raw CSV data from Price Calculator - Pricing Details - Price Download.
Schema
Download Aliyun pricing details and import for analysis
Similarly for AWS EC2, you can download the price list from Vantage:
Visualization